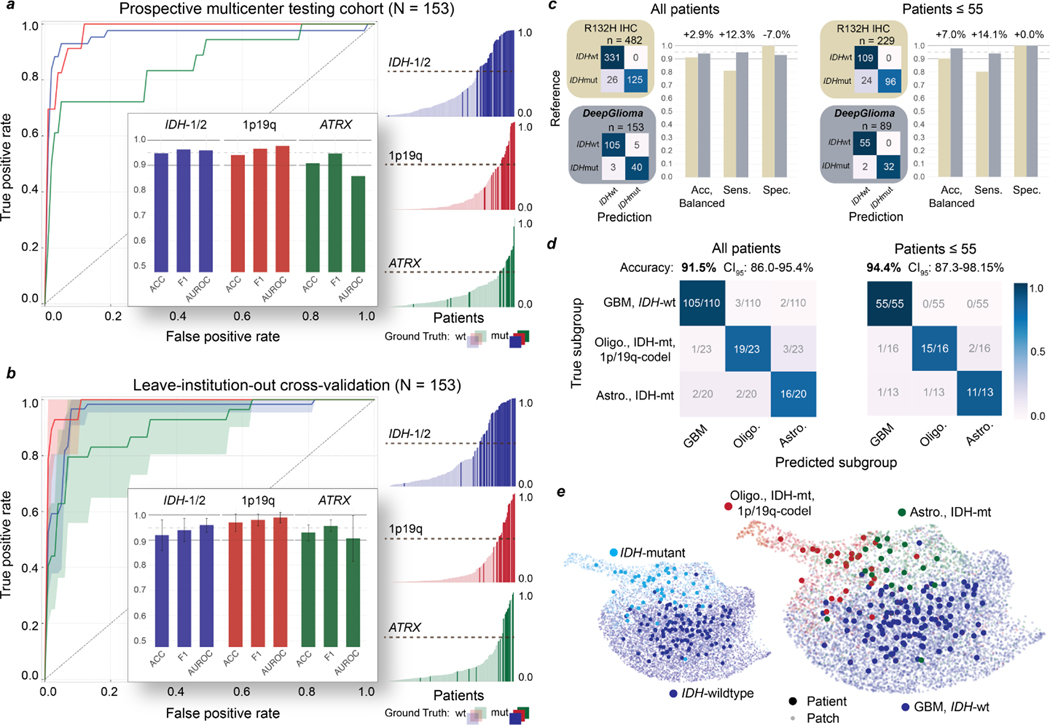
Fig. 2. DeepGlioma molecular classification performance.
a, Results from our prospective multicenter testing cohort of diffuse glioma patients are shown. DeepGlioma was trained using UM data only and tested on our external medical centers. All results are presented as patient-level predictions. Individual ROC curves for IDH-1/2 (AUROC 95.9%), 1p9q-codeletion (AUROC 97.7%), and ATRX (AUROC 85.7%) classification are shown. Our AUROC values were highest for IDH-1/2 and 1p19q-codeletion prediction. Bar plot inset shows the accuracy, F1 score, and AUROC classification metrics for each of the mutations. Similar to our cross-validation experiments, ATRX mutation prediction was the most challenging as demonstrated by comparatively lower metric scores. Individual patient-level molecular genetic prediction probabilities are ordered and displayed. b, Results from the LIOCV experiments. Mean (solid line) and standard deviation (fill color) ROC curves are shown. Metrics are averaged over external testing centers to determine the stability of DeepGlioma classification results given different patient populations, clinical workflows, and SRH imagers. Including additional training data resulted in an increase in DeepGlioma performance, especially for 1p19q and ATRX classification. c, Primary testing endpoint: comparison of IDH1-R132H IHC versus DeepGlioma for IDH mutational status detection. DeepGlioma achieved a 94.2% balanced accuracy for the prospective cohort and a 97.0% balanced accuracy for patients 55 years or less. The major performance boost was due to the +10% increase in prediction sensitivity over IDH1-R132H IHC due to DeepGlioma’s detection of both canonical and non-canonical IDH mutations. d, Secondary testing endpoint: DeepGlioma results for molecular subgrouping according to WHO CNS5 adult-type diffuse glioma taxonomy. Multiclass classification accuracy for all patients and patients 55 years or less are shown. e, UMAP visualization of SRH representations from DeepGlioma. Small, semi-transparent points are SRH patch representations and large, solid points are patient representations (i.e. average patch location) from the prospective clinical cohort. Representations are labeled according to their IDH subgroup and diffuse glioma molecular subgroup. Our patch contrastive learning encourages the SRH encoder to learn representations that are uniformily distributed on the unit hypersphere [32].

