Fig. 2.

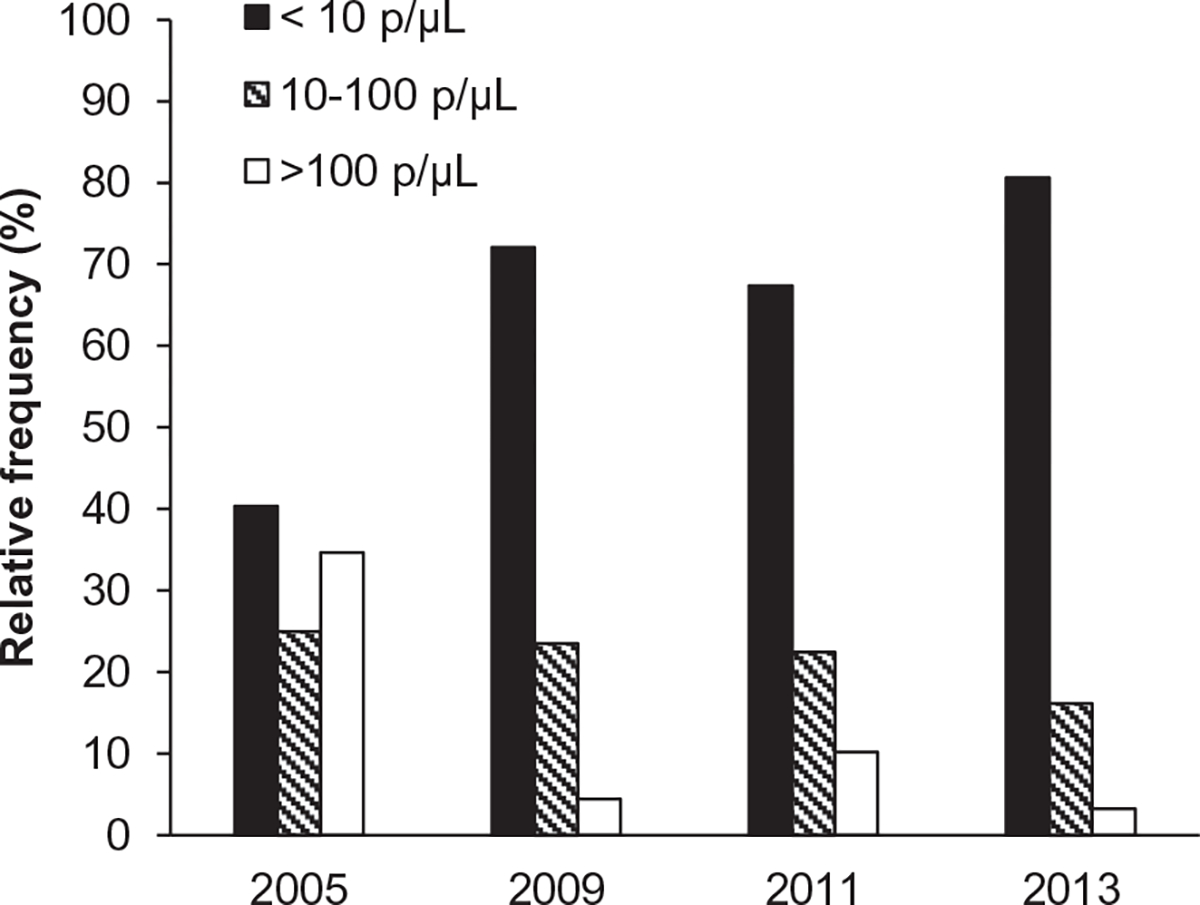
Quantitative PCR-determined parasite densities among asymptomatic persons. A Frequency histogram showing the relative proportion of samples with parasite densities of <10 p/μL, 10–100 p/μL and >100 p/μL by year.

Quantitative PCR-determined parasite densities among asymptomatic persons. A Frequency histogram showing the relative proportion of samples with parasite densities of <10 p/μL, 10–100 p/μL and >100 p/μL by year.