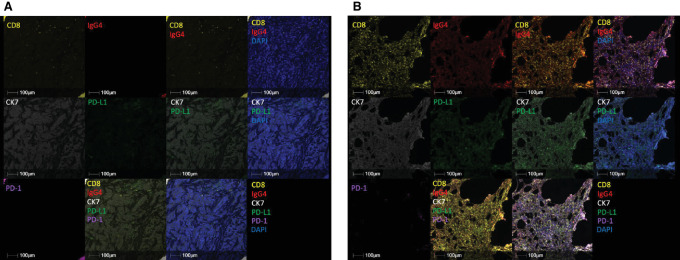
FIGURE 2.
Correlative analysis of tumor specimens. Representative baseline biopsy (A) and on-treatment surgical resection (B) of a patient who responded to treatment. Color scheme, Yellow: CD8, Red: IgG4, White: CK7, Green: PD-L1, Magenta: PD-1, Blue: DAPI. Baseline biopsy demonstrates PD-L1 signal and minimal CD8 infiltration, with no detectable PD-1 or IgG4 signal, while on-treatment biopsy demonstrated diffuse CD8 infiltration colocalized with strong IgG4 signal (double positive = orange), along with minimal PD-1 signal, consistent with the visualization of the IgG4 antibody nivolumab saturating the PD-1 receptor on infiltrating T cells.

