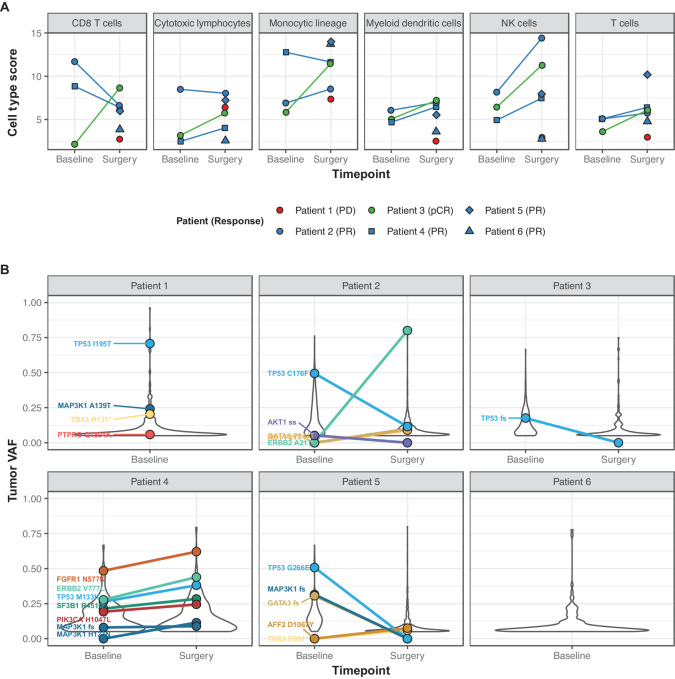
FIGURE 3.
RNA-seq and DNA sequencing analyses of biopsies. A, MCPcounter was used to summarize gene expression scores for immune cell populations from bulk RNA-seq expression data across cell types. Each point represents one sample, and paired baseline/surgery samples are connected by a line (three paired biopsies); individual patients and their responses are indicated by color and point shape. B, Summary of somatic driver mutations by variant allele fraction (VAF). Variants detected at both timepoints are connected by a line (four paired biopsies), and mutations in known genetic drivers of breast cancer are indicated with colored labels.

