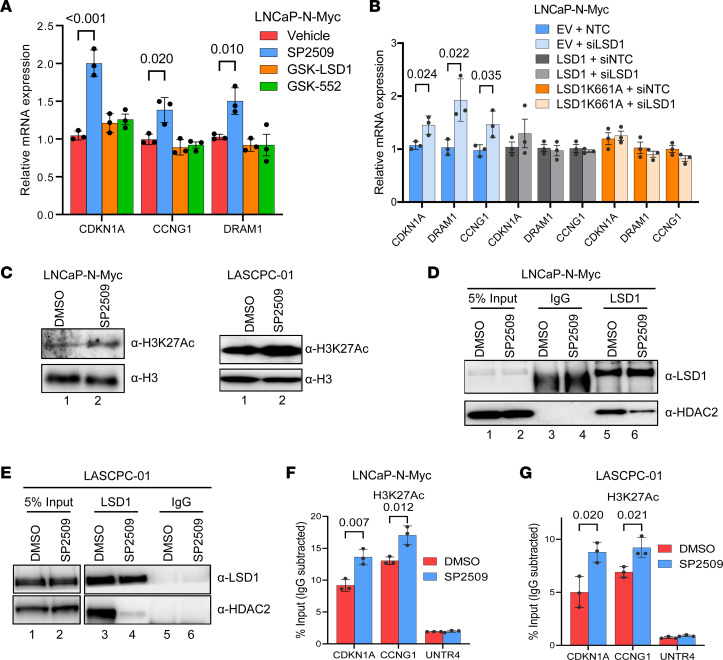
Figure 5. LSD1 inhibition disrupts LSD1-HDAC interaction and increases histone acetylation at TP53 targets.
(A) LNCaP–N-Myc cells were treated with 1 μM catalytic LSD1 inhibitors (GSK-LSD1 or GSK-552) or 600 nM allosteric LSD1 inhibitor (SP2509), and TP53 target gene expression was measured after 48 hours by qPCR, n = 3. (B) LNCaP–N-Myc cells stably expressing empty vector, WT LSD1, or catalytically inactive mutant LSD1 (K661A) were transfected with nontargeting control (NTC) or siRNA targeting the 3′ UTR of LSD1. The expression of TP53 targets was measured by qPCR, n = 3. (C) The indicated NEPC cells were treated with 600 nM SP2509 for 48 hours, and H3K27Ac levels were measured by Western blotting. Total histone H3 levels were used as a loading control. (D and E) The indicated NEPC cells were treated with 600 nM SP2509 for 48 hours, and LSD1-HDAC2 interactions were determined by immunoprecipitation followed by Western blotting. (F and G) LNCaP–N-Myc (F) or LASCPC-01 (G) NEPC cells were treated with DMSO vehicle or 600 nM SP2509 for 48 hours. ChIP was performed with anti-H3K27Ac antibodies. qPCR was performed to amplify promoter regions of TP53 targets (CDKN1A, CCNG1) or a negative control region (UNTR4). Enrichment by IgG control IPs in all the experiments were below 0.1% input, indicating that the enrichment observed with anti-H3K27Ac antibodies in these experiments is specific, n = 3. For A, B, F, and G, data are reported as the mean ± SD. For statistical analysis, unpaired 2-tailed Student’s t tests were performed, and P values are indicated.

