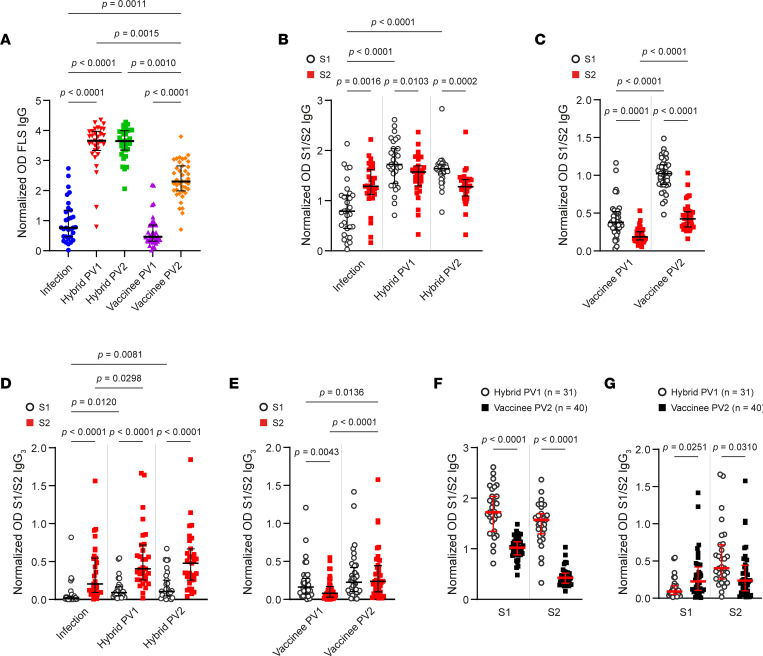
Figure 4. Anti-S1/S2 Ab responses after vaccination, infection, and hybrid immunity.
(A) Circulating anti-FLS IgG Abs from participants with hybrid immunity were measured postinfection (PI; blue circle) and after first (PV1; red chevron) and second (PV2; green square) vaccinations as well as from vaccinated participants (n = 40) PV1 (purple triangle) and PV2 (orange diamond). (B and C) Levels of anti–S1 IgG (open black circle) and anti–S2 IgG (red square) were compared for participants with hybrid immunity (PI, PV1, and PV2) and vaccinees (PV1, and PV2). (D and E) Relative amounts of anti-S1 and anti–S2 IgG3 were measured for persons with hybrid immunity or vaccinees, and anti–S1 IgG3 and anti–S2 IgG3 Ab levels were compared. (F and G) Hybrid- and vaccine-induced anti–S1 and anti–S2 IgG and IgG3 were contrasted. P values in A, F, and G were calculated using Kruskal-Wallis test with Dunn’s multiple-comparison test or, in B–E, using Friedman’s test with Dunn’s multiple-comparison test and are shown above horizontal lines spanning comparison groups when significant. Lines bisecting groups represent median with IQR.

