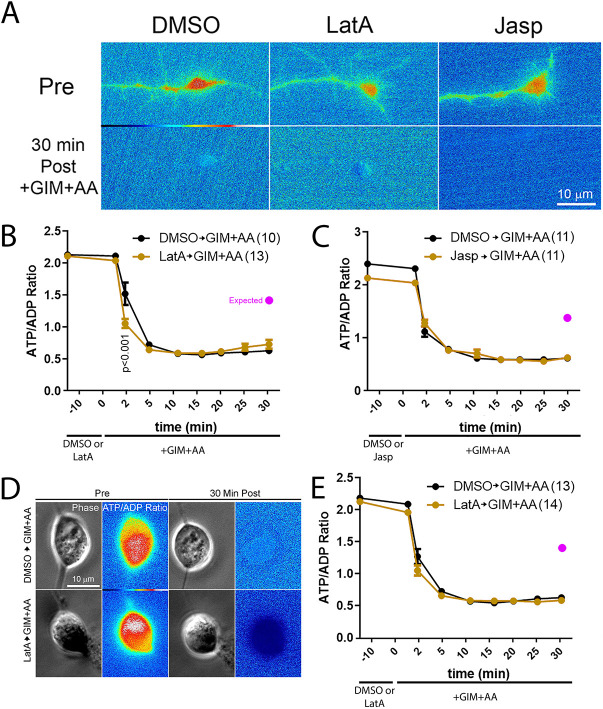
Fig. 2.
Manipulation of actin filament dynamics does not impact the decrease in the ATP/ADP ratio or ATP level induced by blockade of ATP production in either growth cones or cell bodies. (A) Representative ratiometric images of the ATP/ADP ratio assessed in growth cones using PercevalHR in growth cones pretreated for 10 min with DMSO, latrunculin-A or jasplakinolide prior to a 30 min treatment with GIM+AA. In all conditions, the ATP/ADP ratio is similarly suppressed. (B) Graph of the ATP/ADP ratio in growth cones as a function of time after a 10 min pretreatment with DMSO or latrunculin-A prior to a 30 min treatment with GIM+AA. Bonferroni post-hoc time point-matched tests yield P>0.05 at all the time points after GIM+AA treatment with the exception of 2 min of GIM+AA treatment in latrunculin-A treatment conditions. (C) Graph of the ATP/ADP ratio in growth cones as a function of time after a 10 min pretreatment with DMSO or jasplakinolide prior to a 30 min treatment with GIM+AA. Bonferroni post-hoc time point-matched tests yield P>0.05 at all the time points after GIM+AA treatment. (B,C) Power analysis, as described in the Materials and Methods section, indicates that to detect a 50% difference in the extent of the decrease of the ATP/ADP ratio following GIM+AA treatment at the latest time point imaged (30 min) a sample size of 2 and 2 in the experimental groups for latrunculin-A or jasplakinolide, respectively, would be required, and the samples sizes were between 10–13 in all groups. (D) Representative ratiometric images of the ATP/ADP ratio assessed in the cell bodies of sensory neurons using PercevalHR that were pretreated for 10 min with DMSO or latrunculin-A prior to a 30 min treatment with GIM+AA. (E) Graph of the ATP/ADP ratio in cell bodies as a function of time after a 10 min pretreatment with DMSO or latrunculin-A prior to a 30 min treatment with GIM+AA. Bonferroni post-hoc time point-matched tests yield P>0.05 at all the time points after GIM+AA treatment. (D,E) As above, power analysis indicates that to detect a 50% difference in the extent of the decrease of ATP/ADP ratio following GIM+AA treatment at the latest time point a sample size of 2 in the experimental group for latrunculin-A would be required, and the data set consisted of 13 cell bodies. In panels B, C and E the purple circle denotes the expected mean for a 50% decrease in the decline of the ATP/ADP ratio. Results are shown as mean±s.e.m.

