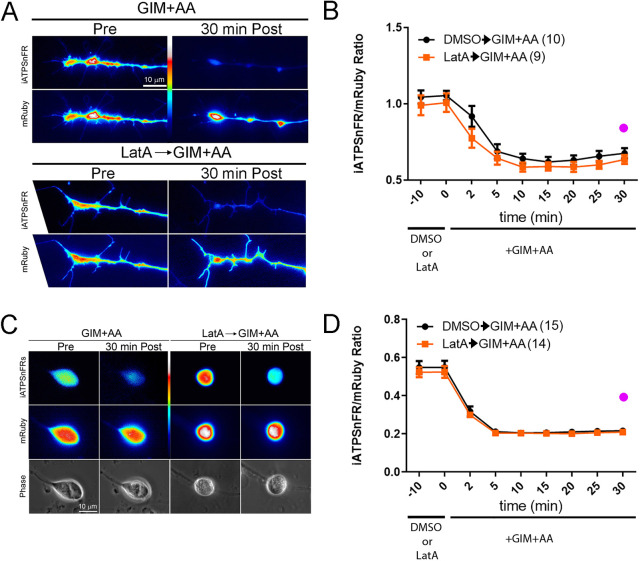
Fig. 3.
Depolymerization of actin filaments has no effect on the decline in the level of ATP induced by blockade of ATP production in either growth cones or cell bodies. (A) Examples of the effects of GIM+AA and pretreatment with latrunculin-A or jasplakinolide on the intensity of iATPSnFR and mRuby in growth cones. For presentation, the iATPSnFR and mRuby channels are shown separately as the ensuing average ratio at baseline is approximately one (growth cones, B) or lower (cell bodies, D). The iATPSnFR intensity in growth cones decreases to a similar extent from the initial baseline with or without latrunculin-A pretreatment (10 min) after a 30 min treatment with GIM+AA. (B) Graph of the iATPSnFR/mRuby ratio in growth cones as a function of time after a 10 min pretreatment with latrunculin-A or DMSO followed by treatment with GIM+AA. Bonferroni post-hoc time point-matched tests after GIM+AA treatment between DMSO and LatA treatment yield P>0.05 at all time points. (C) Examples of the iATPSnFR and mRuby channels in the cell bodies of sensory neurons pretreated with DMSO or latrunculin-A followed by a 30 min treatment with GIM+AA. Phase-contrast images of the cell bodies are also shown. (D) Graph of the iATPSnFR/mRuby ratio in cell bodies as a function of time after a 10 min pretreatment with latrunculin-A or DMSO followed by treatment with GIM+AA. Bonferroni post-hoc time point-matched tests after GIM+AA treatment between DMSO and LatA treatment yield P>0.05 at all time points. (A–D) Power analyses indicate that to detect a 50% difference in the extent of the decrease of the mRuby-iATPSnFR ATP ratio following GIM+AA treatment at the latest time point sample sizes of 2 and 5 in the experimental groups for latrunculin-A would be required for cell bodies and growth cones, respectively, and 14 and 9 cell bodies and growth cones were sampled, respectively. In panels B and D, the purple circle denotes the expected mean for a 50% decrease in the decline of the iATPSnFR/mRuby ratio. Results are shown as mean±s.e.m.

