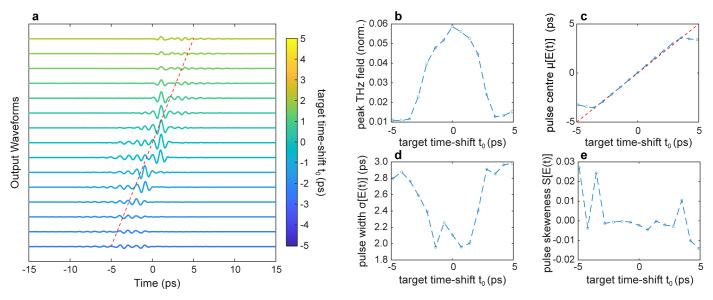
Figure 3. Time shift control of a THz pulse.
a. Temporal profiles of the output THz pulses optimised for different values of time delay t 0. b. THz peak field as a function of the time delay t 0. c First central moment μ, corresponding to the pulse centre, as a function of the time delay t 0. The red dashed line represents the desired time-delay μ = t 0. d. The second central moment σ, corresponding to the pulse width, as a function of the time delay t 0. e Third central moment S, corresponding to the pulse symmetry, as a function of the time delay t 0. Numerical parameters: spectral correlation Δ v c = 250 GHz, number of generations 20000, size of population per generation 50, and weight factors { α, β, γ, ζ} ≡ {10 2, 5 ⋅ 10 12, 10 12, 1}.

