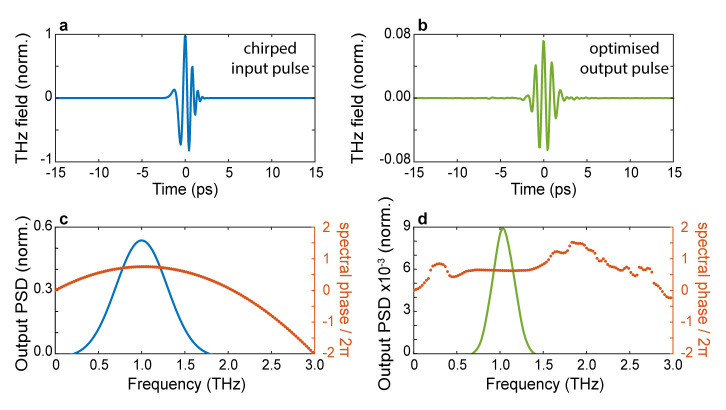
Figure 4. Chirped-pulse compression.
a. The input temporal trace of an initially chirped pulse. b. Temporal trace of the optimised pulse. c. Power spectral density of the input pulse (blue line) and spectral phase (orange dots). d. Power spectral density of the optimised pulse (blue line) and spectral phase (orange dots). The algorithm tries to fit the output spectral phase as close as possible to the phase of a transform-limited pulse. Numerical parameters: spectral correlation Δ v c = 250 GHz, number of generations 10000, size of population per generation 300.

