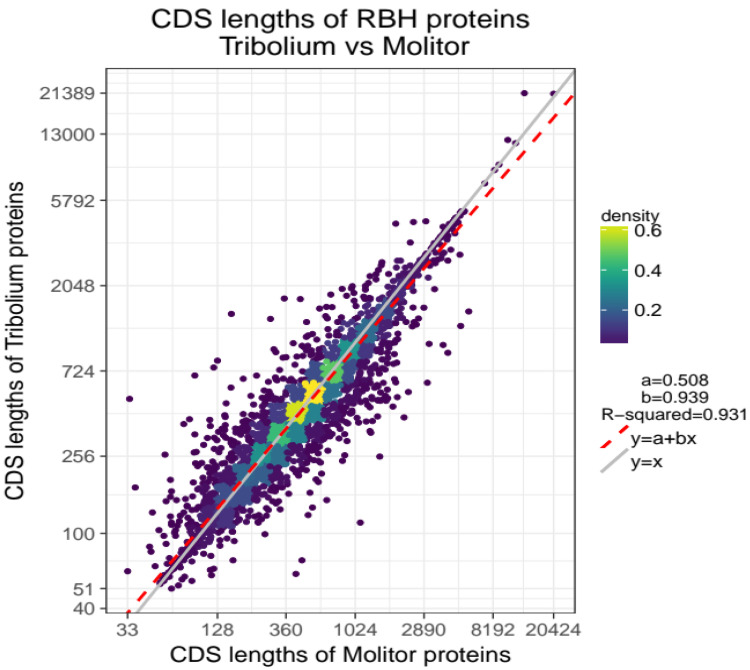
Figure 1. CDS length association for 10,495 orthologous genes of T. molitor and T. castaneum.
Comparison plot with CDS lengths of T. molitor on x-axis and CDS lengths of T. castaneum on y-axis. Lengths (points) are log-scaled and coloured based on their density (highest density= yellow, lowest density=dark violet). The linear regression model best fitting the data is represented by the red-dashed line y = a + bx with parameters a=0.508 and b=0.939. Higher densities are observed in the central part of the cloud and along the red-dashed fitted regression line.

