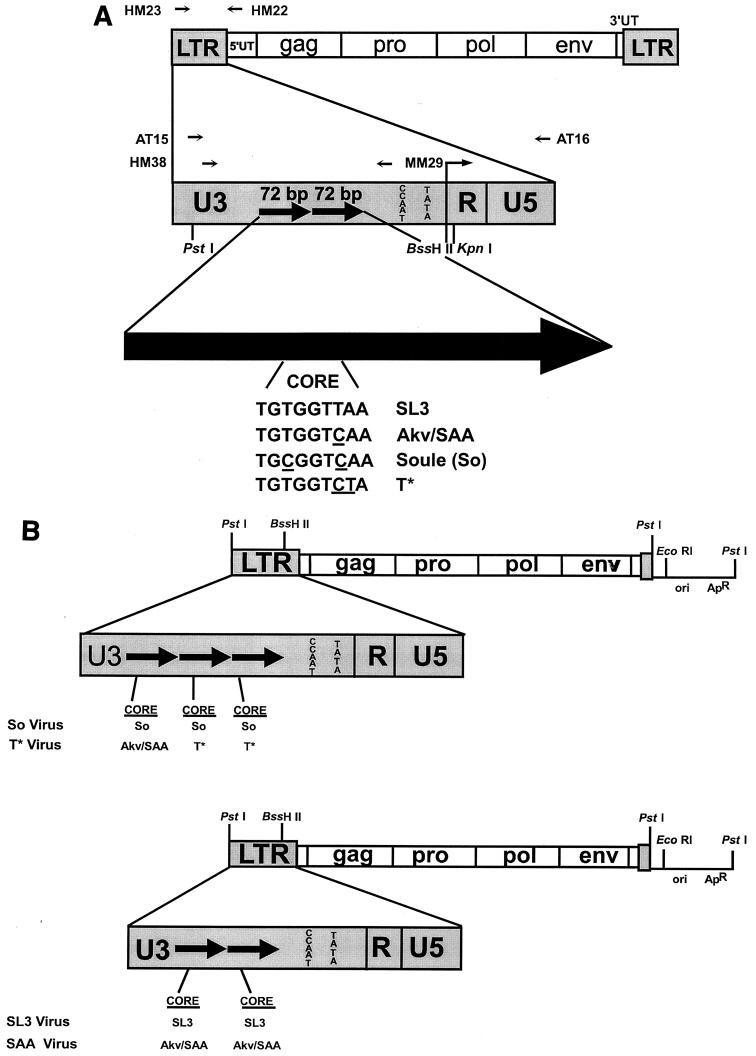
FIG. 1.
Structures of the viruses and viral plasmids used in these studies. (A) Structures of the viral LTRs and sequences of the viral core elements. The top diagram shows the structure of the genome of proviruses of SL3 and the mutants derived from SL3. HM23 and HM22 are the PCR primers that were used to amplify the viral LTRs from tumor cell DNAs. The second diagram shows the structure of the viral LTRs. PCR primers used for sequencing studies are shown above the diagram. Restriction sites used for cloning experiments are shown below the diagram. The large arrow at the bottom represents one 72-bp enhancer repeat. The sequences of the cores present in the SL3, SAA, So, and T* enhancers are shown. Nucleotides that differ relative to the SL3 core are underlined. (B) Structures of the plasmids used to generate infectious virus particles. The top diagram represents the viruses with So and T* core mutations. The bottom diagram represents structures of the SL3 and SAA virus clones. In each diagram, the viral sequences are shown as boxes while the plasmid vector sequences are shown as lines. LTR sequences are enlarged to show the numbers of 72-bp enhancer repeats, which are indicated as black arrows. The sequence of the core in each repeat is shown below the LTR. Akv and SAA have the same core sequence; thus, this core is represented as Akv/SAA.

