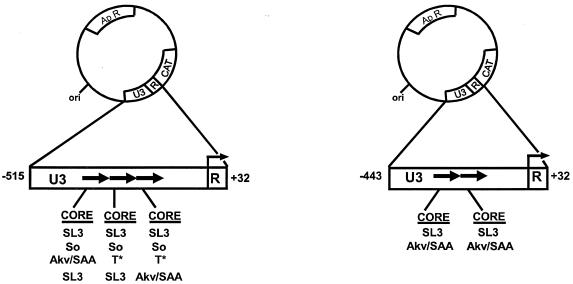
FIG. 5.
Structures of the plasmids used to measure transcriptional activities of the viral LTRs. Positions of the U3 and R sequences from the viral LTRs are shown. The CAT gene, ampicillin resistance gene (Apr), and plasmid origin of replication (ori) are also indicated. The arrow at the U3-R boundary indicates the direction of transcription. Numbers represent distance from transcription initiation site. Black arrows in the boxes below the circles indicate the numbers of 72-bp repeats in the viral LTRs that were tested. The enhancer core sequences within each LTR of the plasmids are depicted below the arrows.

