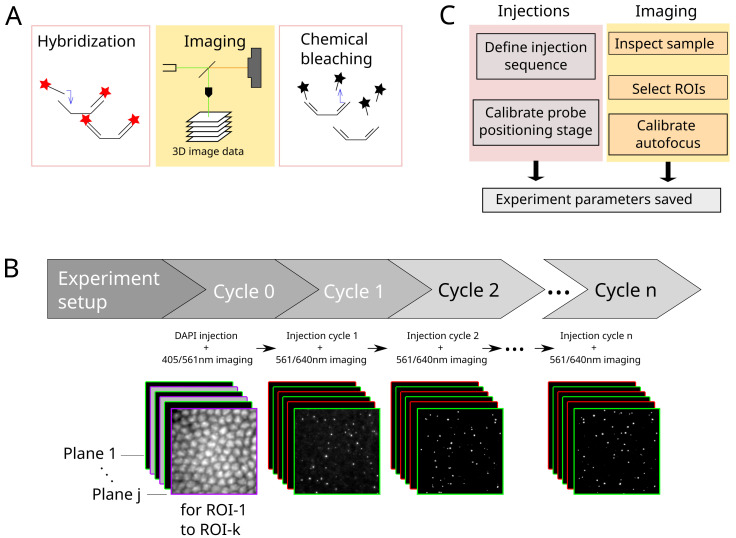
Figure 5.
A. Each cycle in a Hi-M experiment consists of the hybridization with imaging probes, image data acquisition and subsequent chemical bleaching. B. Process flow of a typical Hi-M experiment. Multiple-color 3D images are acquired in each cycle, for multiple ROIs. From cycle 1 on, the experiment runs autonomously. C. Overview of steps performed during experiment preparation for subsequent automatized fluidics handling and imaging.

