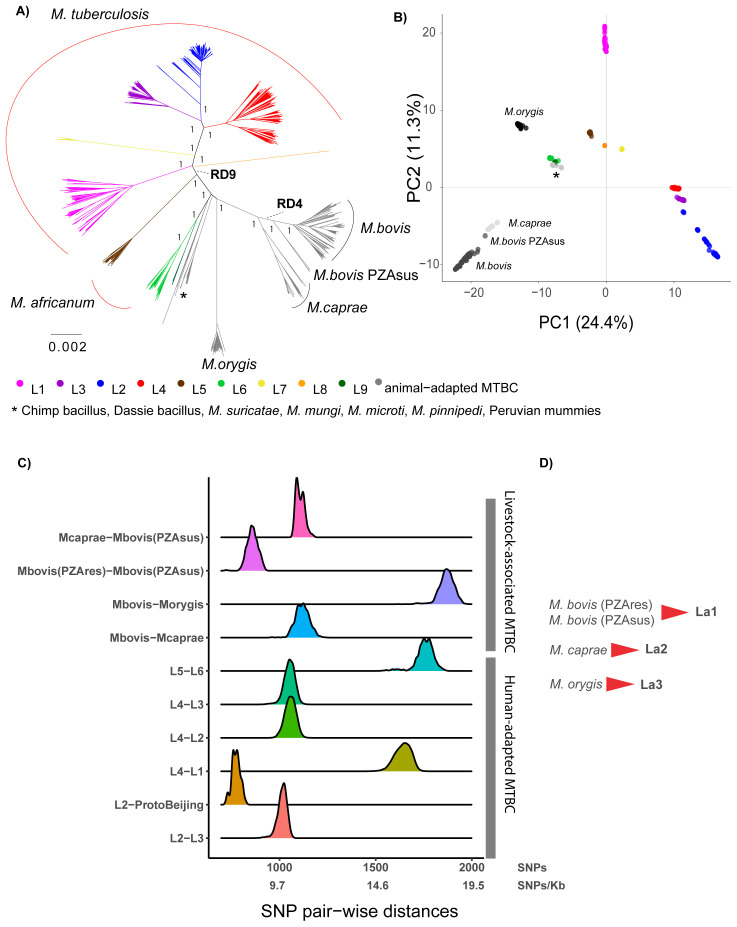
Figure 1.
A) Maximum Likelihood topology of 1,226 MTBC representatives, where 50 representatives were randomly selected from each continent and from each lineage (see methods). The tree was inferred from an alignment containing 103’841 polymorphic positions. Branch lengths are proportional to nucleotide substitutions. Support values correspond to bootstrap values. Members of the human-adapted MTBC have tips colored according to their lineage. B) Principal Component Analysis (PCA) derived from the same alignment as the phylogeny. The two first principal components are shown. C) Distribution of the raw pairwise SNP distances between human adapted MTBC lineages and between different animal adapted MTBC members. D) Proposed lineage nomenclature for M. bovis susceptible and resistant to pyrazinamide, M. caprae and M. orygis.

