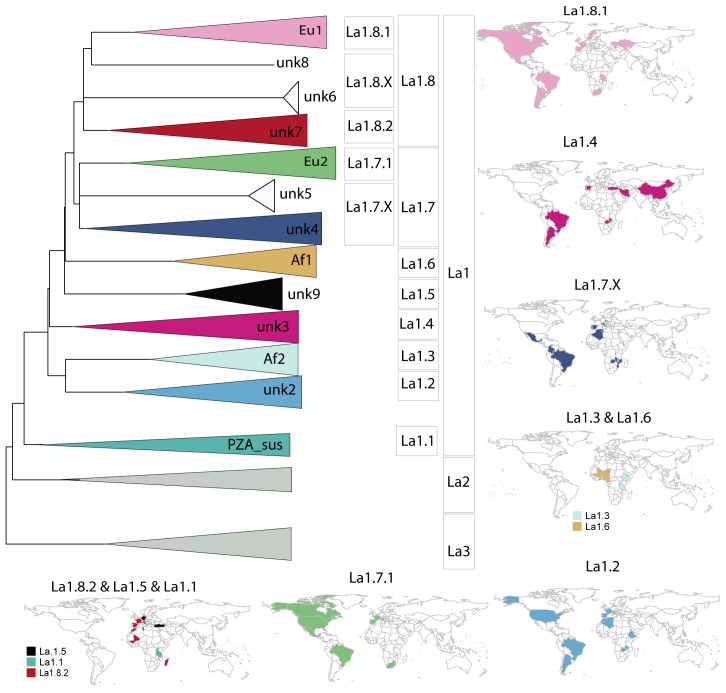
Figure 5.
A) Schematic illustration of La1 sublineages. The length of the branch is not proportional to genetic distances. Groups without strong bootstrap support (<80) are shown as polytomies. Color codes are the same as in Figure 4. B) Geographic distribution of La1 sublineages informed by WGS and in silico spoligotype patterns (Extended data: Table 3).

