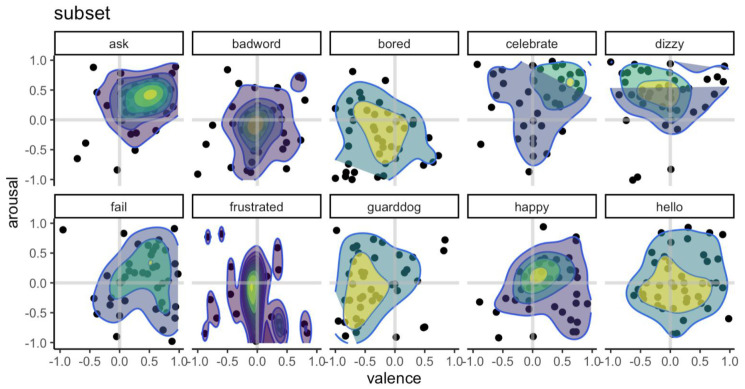
Figure 6. Valence and arousal ratings for a subset of the animations (Experiment 1B).
While ratings vary across participants, the animations are associated with a distinct profile on the valence/arousal grid. The x-axis shows the valence rating for each of the animations, ranging from -1 (negative) to 1 (positive), while the y-axis shows the arousal rating, ranging from -1 (relaxed/inactivated) to 1 (stimulated/activated). The heatmap represents both the density of the valence and arousal rating. Each dot represents a rating for an animation by a participant.

