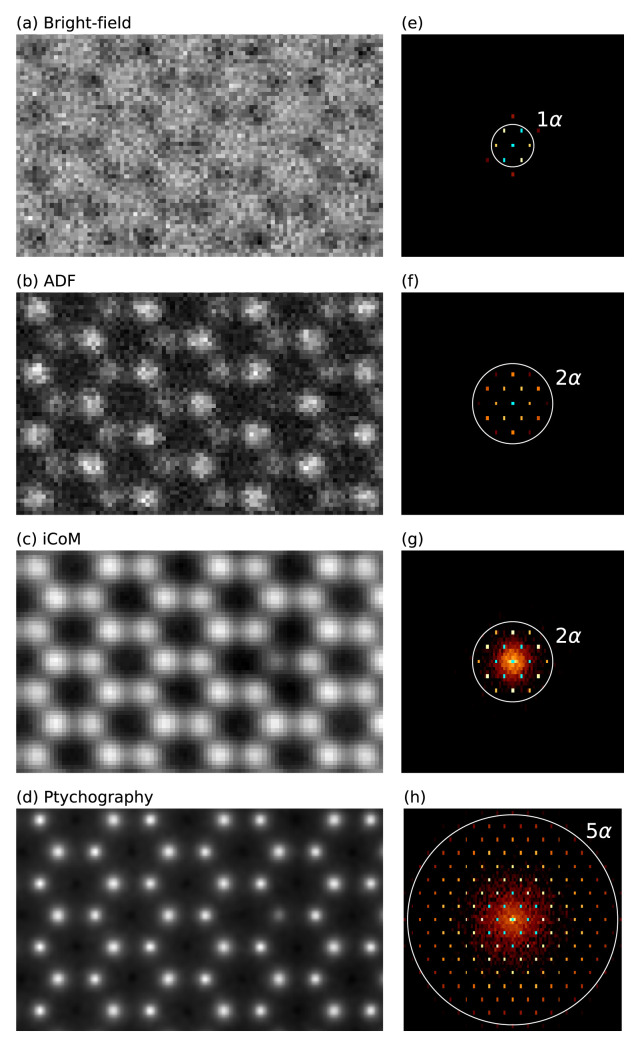
Figure 3. 4D-STEM simulations of MoS 2 with a single S vacancy.
( a)–( c) Bright-field, annular dark field (ADF), and integrated center of mass (iCoM) (0.21 Å sampling) measurements and ( d) ptychographic phase reconstruction (0.45 Å sampling), all derived from pixelated detector measurements with applied Poisson noise. ( e)–( h) Diffractograms displayed on logarithmic scale calculated from the images and colored with the color map ‘afmhot’ with a cyan color set for the brightest values. For the experimental work that inspired this example, see Ref. 53.

