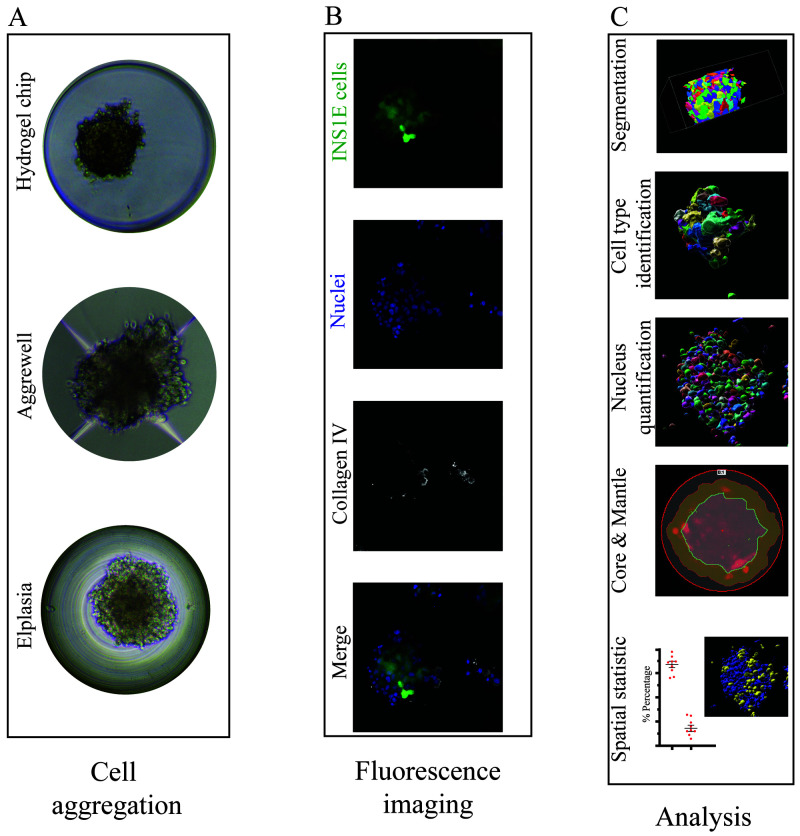
Figure 1. Overview of microwell culture platforms and analysis by microscopy.
( A) Three different microwell systems were compared for their support of the formation of aggregates and immunofluorescence staining. ( B) The different cells were quantified by max intensity projection of 70 z-stack images (z-distance of 0.3 µm), and each image displayed the aggregated INS1E cells (mNeonGreen2, green), nuclei (Sytox orange, blue) and collagen IV (white). ( C) Illustration of the software workflow beginning with cell masking followed by segmentation and quantification of the nuclei and cell types. Subsequently, the regions of core and mantle and overlapping signals were analysed.

