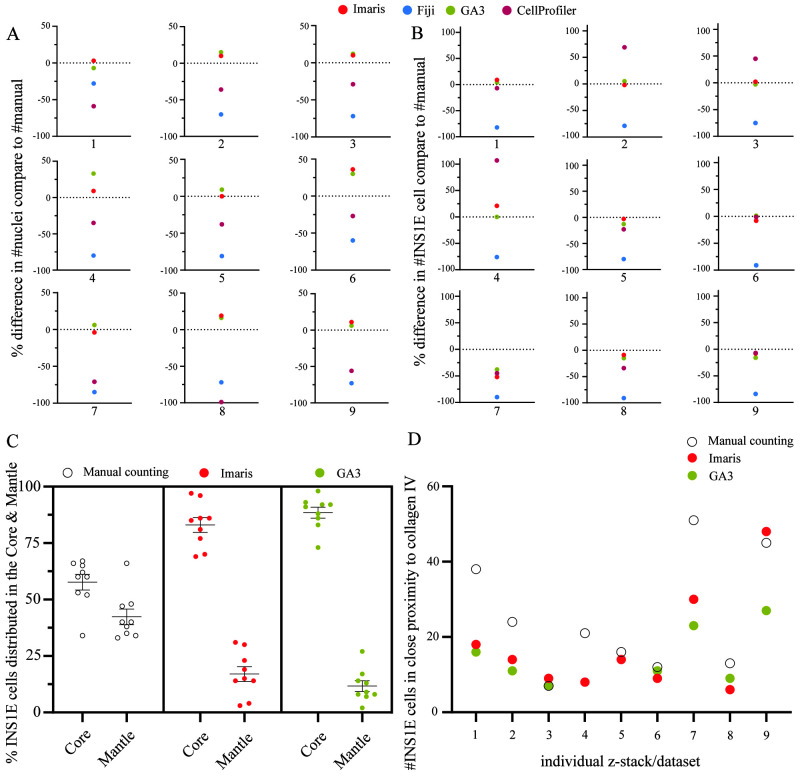
Figure 4. Comparison of the software performance.
( A) GA3 and Imaris produced equal quantification of the nuclei except in image four, where GA3 slightly overestimated the count compared to Imaris. In most z-stacks, CellProfiler was closer to the manual count than Fiji except in dataset one and eight. However, overall, they underestimated the number of nuclei. ( B) For the quantification of single cells, both GA3 and Imaris, resulted in equal counts as the manual count except in dataset four and seven. However, CellProfiler showed equal accuracy as GA3 and Imaris in many z-stacks, except in dataset two, three, four and eight. Fiji had a consistent underestimation of ~83% in all datasets. ( C) Comparing the distinction between core and mantle in the aggregates. The manual counting had a lesser distinction between the core and mantle distribution of the INS1E cells compared to both GA3 and Imaris that used a percentage area distribution mask to quantify the distribution of the cells in each area. This resulted in an 89% and 17% core versus mantle distribution in GA3 and 83% and 17% in Imaris. ( D) Another method was to quantify overlapping signals between two immunofluorescence channels within a 0 µm distance. The GA3 and Imaris software resulted in equal count except in datasets nine and seven. However, in most situations, the manual quantification had a higher count than GA3 and Imaris. Only dataset three, five, six and eight had comparable results as the software. Results are calculated by the relative change, and the data set included nine z-stack data sets.

