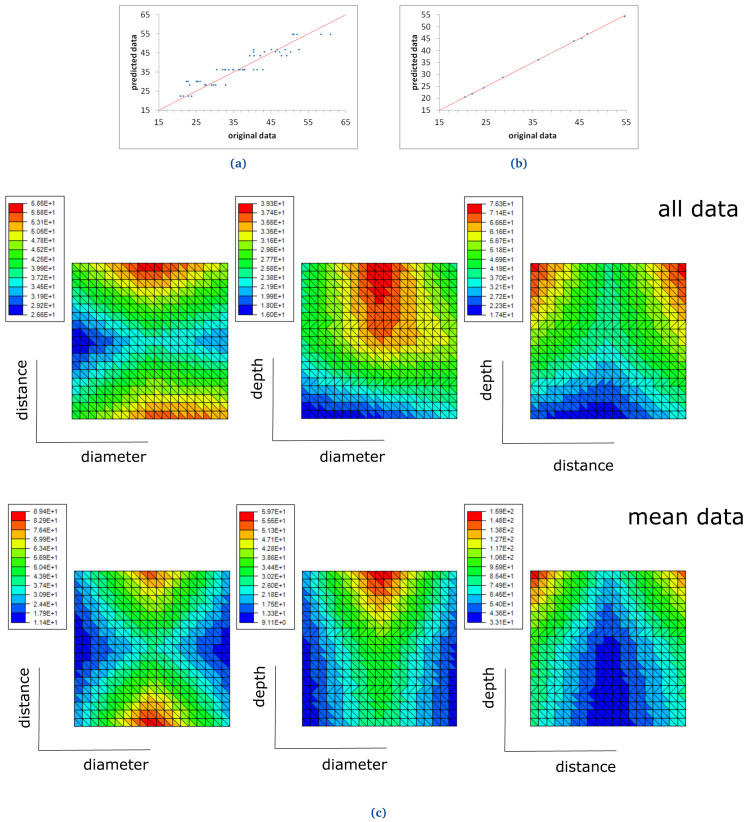
Figure 19.
NBR70 ROM prediction with ( a) six terms, when all demoulding force data are used and ( b) two terms, when mean demoulding force values are used. The red line in ( a) and ( b) shows the ideal prediction, i.e. when the predicted data perfectly matches experimental data. NBR70 response surfaces for demoulding force ( c). The response surfaces include graphics of "all data" (i.e., no mean values nor standard deviations are considered) and "mean data" (see top and bottom graphs respectively).

