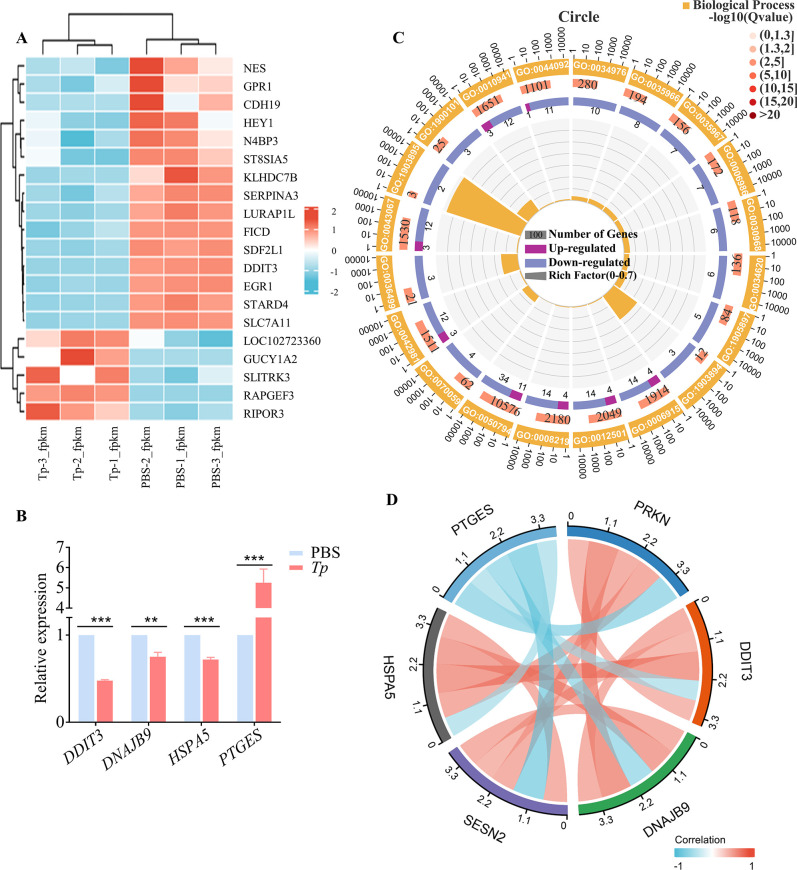
Fig 3. RNA sequencing revealed that Tp induces microglial activation and pathogenicity.
The gene transcription of HMC3 cells treated with Tp and untreated HMC3 cells was analysed by using RNA sequencing. (A) Heatmap showing hierarchical clustering of differentially expressed mRNAs. Red indicates relatively high expression, and blue represents relatively low expression. (B) Four genes were randomly selected to verify the results of transcriptome analysis by real-time qPCR. **P < 0.01, ***P < 0.001, n = 3. (C) GO enrichment analysis. (D) Correlation analysis of apoptotic gene and autophagy signalling pathway gene expression data from RNA-Seq.

