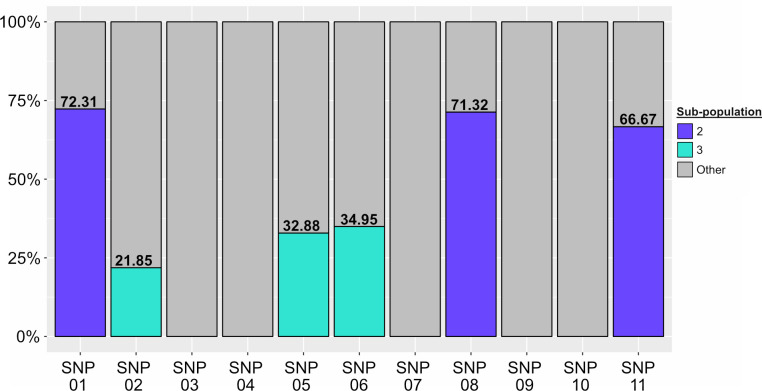
Fig 5. Proportions of the three sub-populations in CIDM-STyphi-BMG inferred from read mapping data over the 11 discriminatory SNP positions.
Stacked histograms are colour-coded according to the figure key. As each position is discriminatory for only one sub-population, reads that do not carry the discriminatory SNP for each position were classified as “Other”. Proportions of sub-populations are listed above their coloured bar. Stacked histogram generated using ggplot 2 version 3.3.6 [52].

