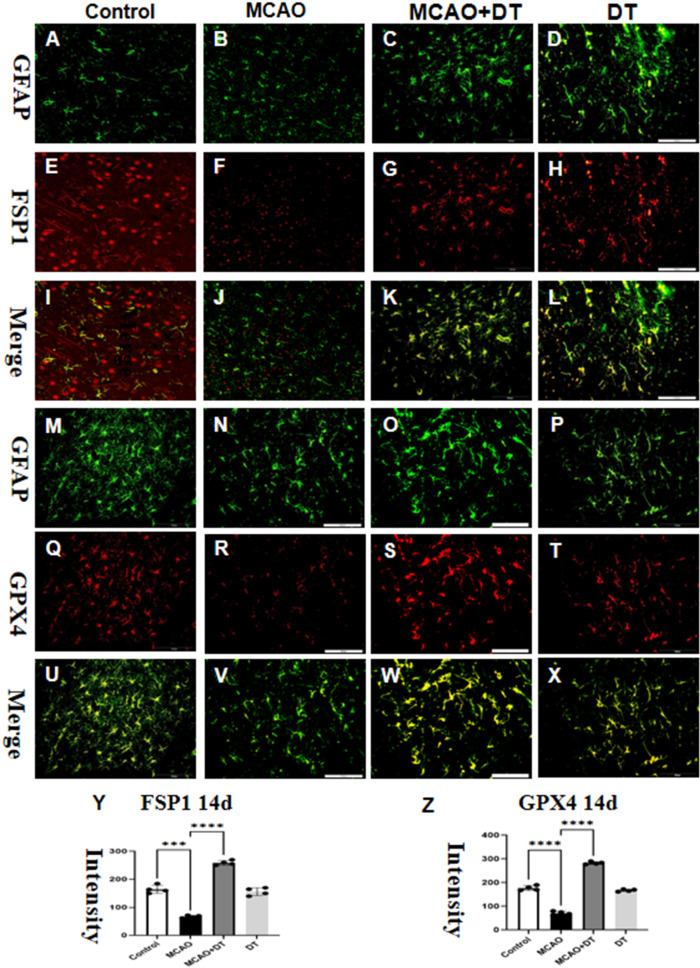
Figure 6.
Tregs depletion inhibited the astrocytes of ferroptosis. Immunofluorescence was used to show distributions of FSP1 (red, E–H) and GFAP (green, A–D) with the merge pictures shown in (I–L). Double labeled immunofluorescence showed the expression of GFAP (green, M–P) and GPX4 (red, Q–T), and the co-localization was shown in (U–X). The flow cytometry image is shown in (Y) and (Z), with a sample size of N=4 and significance level of ***P<0.005, and ****P<0.001. Scale bars for (A–X) were set at 50 μm.

