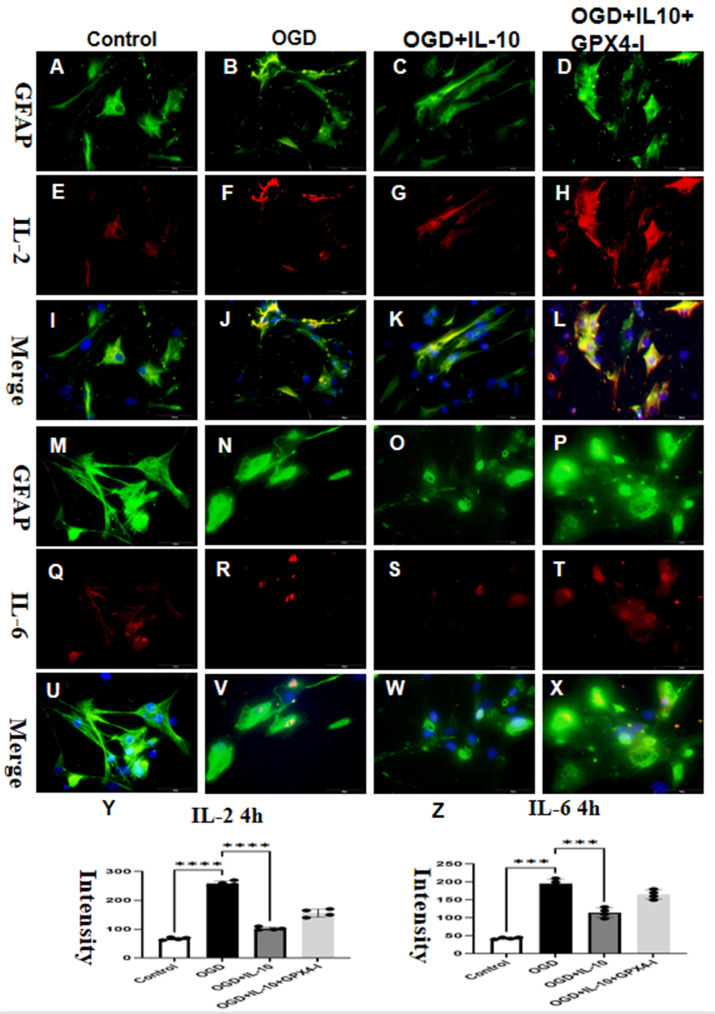
Figure 7.
IL-10 inhibited the expression of IL-6 and IL-2 in vitro. Immunofluorescence was used to show distributions of IL-2 (red, E–H) and GFAP (green, A–D) with the merge pictures shown in (D, H, L, Y). Double labeled immunofluorescence showed the expression of GFAP (green, M–P) and IL-6 (red, Q–T), and the co-localization was shown in (U–W) and (X, Z). with a sample size of N=4 and significance level of ***P<0.005, and ****P<0.001. Scale bars for (A–X) were set at 50 μm.

