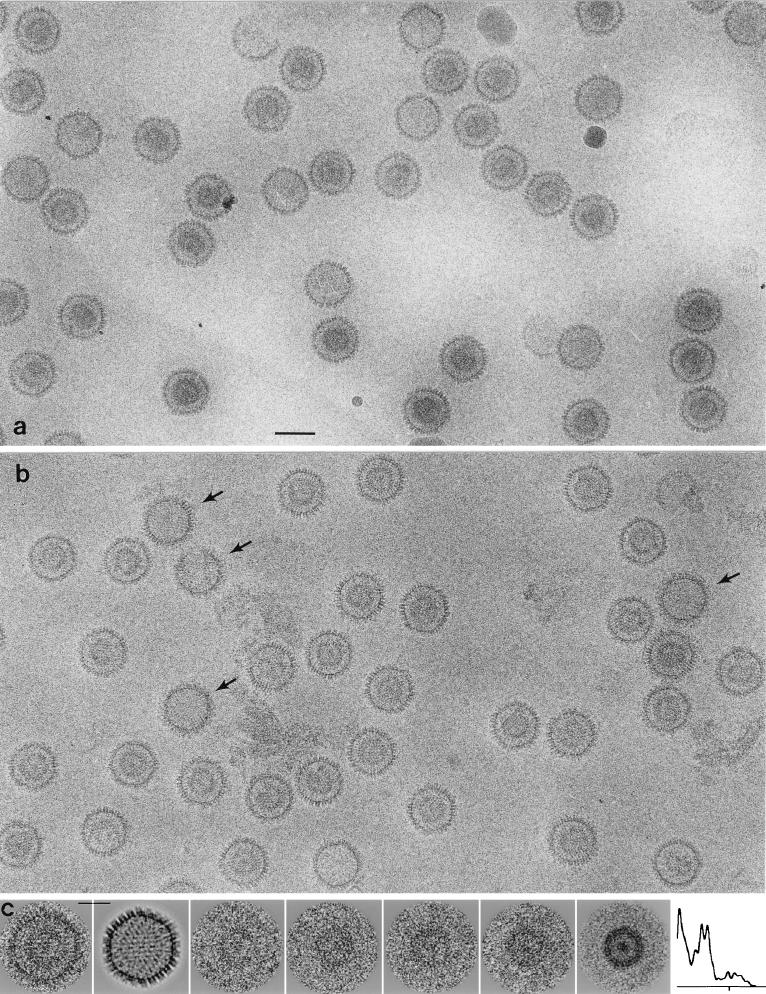
FIG. 2.
Cryoelectron micrographs of purified SCMV B-capsids (nuclear [a] and cytoplasmic [b]). (b) Several heavily tegumented capsids are marked with arrows in panel b. Also present in panel a is a phage T4 virion, which was included because its tail provided an internal magnification standard. Bar, 100 nm. (c) Gallery of cores of nuclear B-capsids. The three left panels show such a capsid and the separated images of its surface shell and core. Bar, 50 nm. The next three panels show the cores of other capsids. The last two panels show an averaged image of the core and a radial density profile calculated by rotational averaging of this image. They disclose a double ring surrounding some central density. The tick mark on the x axis of the density profile denotes a radius of 50 nm.

