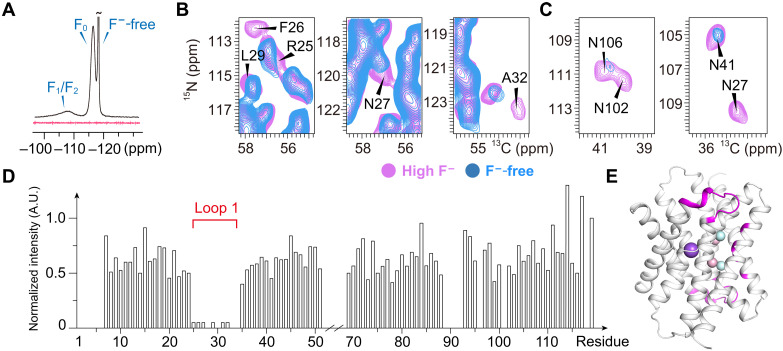
Fig. 3. Spectral difference between the high-F− sample and the F−-free sample.
(A) Direct 19F-detected ssNMR spectra of high-F− sample (black) and F−-free sample (red). Comparison of 2D NCA (B) and NCOCA (C) spectral close-ups of residues (marked as a black font) with a notable signal intensity decrease in the F−-free sample compared to the high-F− sample. (D) The signal-to-noise ratio of the NCA spectrum is shown as a histogram, and loop 1 (R25FNPLHQAIPL35) is indicated. A.U., arbitrary unit. (E) Residues with notably decreased signals are shown in magenta on the structure model.

