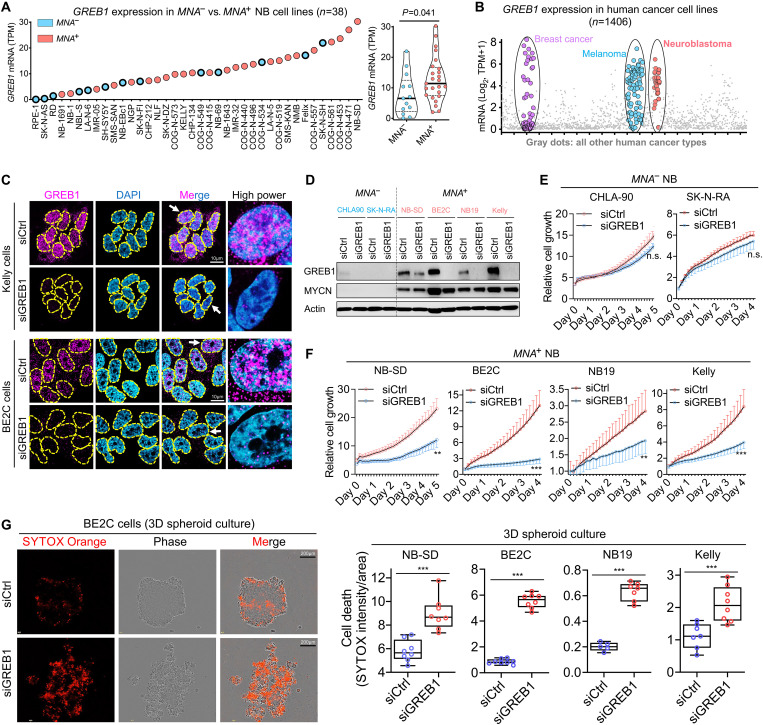
Fig. 1. The pro-oncogenic function of GREB1 in MNA+ NB.
(A) Comparison of GREB1 expression levels in a panel of MNA− and MNA+ NB cell lines. Data were extracted from Gene Expression Omnibus GSE89413. (B) The expression profile of GREB1 in human cancer cell lines plotted based on data from the DepMap database_Expression Public 22Q4. (C) Immunofluorescence (IF) analysis of GREB1 in MNA+ NB cells Kelly and BE2C, and cells with GREB1 gene depletion were used as controls. (D) Western blotting analysis of the indicated proteins in NB cells transfected with siCtrl or siGREB1. (E and F) The impact of GREB1 gene depletion on cell growth was evaluated by Incucyte in MNA− versus MNA+ NB cells (n = 6 to 8). (G) Anoikis induced by GREB1 gene depletion was evaluated by Incucyte with SYTOX Orange labeling in 3D spheroid cultures at day 4 (n = 5 to 8). For all panels, data are presented as means ± SD. P values were determined by two-tailed unpaired Student’s t test. n.s., no significance; **P < 0.01; ***P < 0.001.

