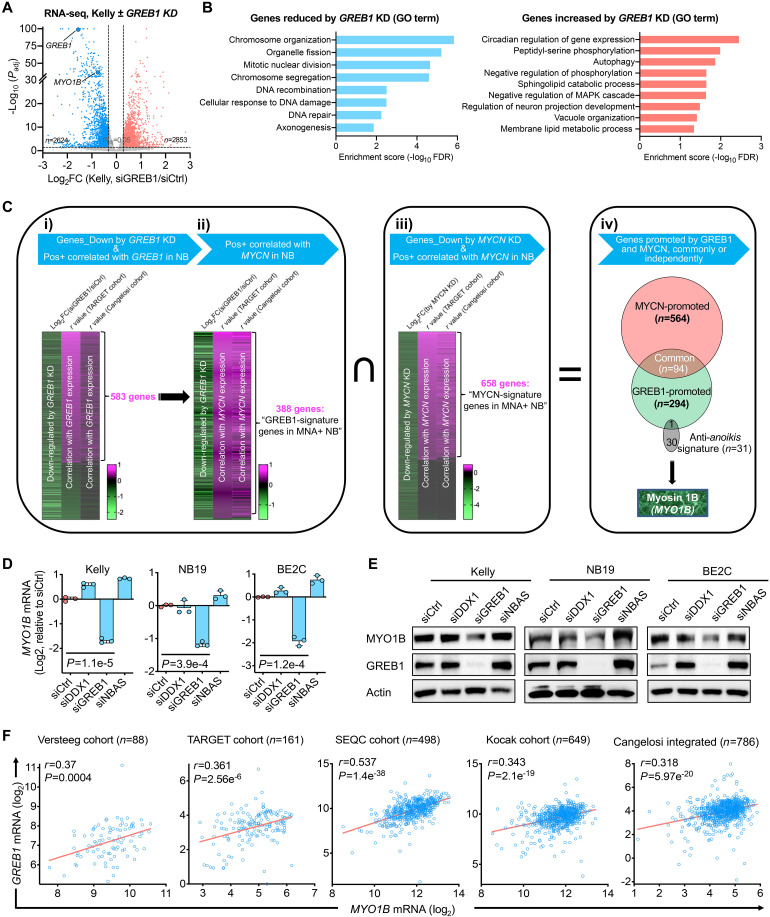
Fig. 2. Identification of a GREB1-controlled gene signature in MNA+ NB independent of MYCN.
(A) RNA-seq analysis in Kelly cells ± GREB1 knockdown (KD). The analysis was performed in triplicate. (B) Gene Ontology (GO) analysis of the gene sets significantly reduced/increased by GREB1 KD in Kelly cells [genes with log2 fold change (FC) of >0.3 or <−0.3 were included]. GO term analysis was performed using the PANTHER database, and the GO-Slim Biological Process was analyzed. (C) Gene sets and procedures used for the integrated analysis, which identified a GREB1-controlled gene signature in MNA+ NB independent of MYCN. (D and E) MYO1B expression changes upon KD of the indicated genes assessed by quantitative polymerase chain reaction (D) and immunoblotting (E). (F) Correlation between GREB1 and MYO1B mRNA expression in five cohorts of NB patient samples based on data derived from the R2 database. Data presented are means ± SD; P values were determined by two-tailed unpaired Student’s t test. Pearson coefficient analysis was performed to determine correlations between two variables.

