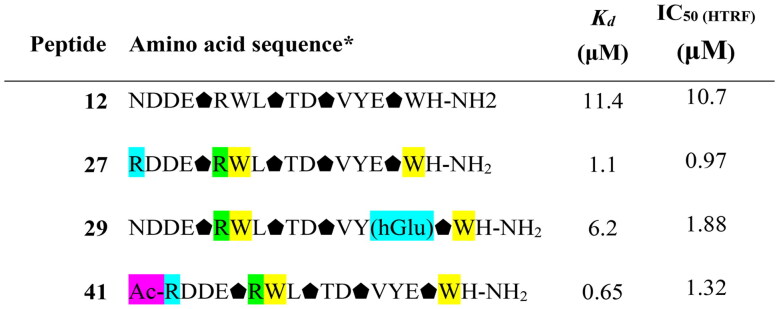
Table 5.
Comparison of Kd values obtained via BLI screening and IC50 values obtained from the HTRF assay for selected peptides with the most pronounced activity.

|
* amino acid residue coding and colouring is the same as in Table 4
Comparison of Kd values obtained via BLI screening and IC50 values obtained from the HTRF assay for selected peptides with the most pronounced activity.

|
* amino acid residue coding and colouring is the same as in Table 4