. 2023 Aug 23;12:e84296. doi: 10.7554/eLife.84296

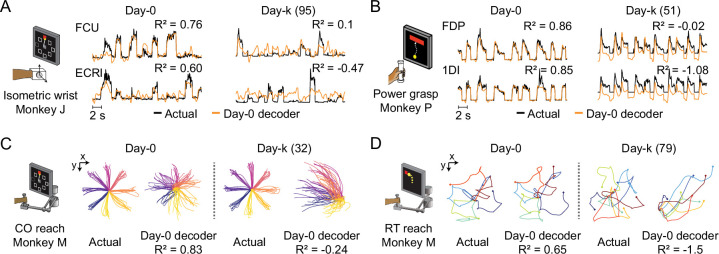
Figure 2. The performance of well-calibrated decoders declines over time.

(A) Actual EMGs (black) and predicted EMGs (orange) using the day-0 decoder for flexor carpi ulnaris (FCU) and extensor carpi radialis longus (ECRl) during the isometric wrist task. (B) Actual and predicted EMGs using the day-0 decoder for flexor digitorum profundus (FDP) and first dorsal interosseous (1DI) during the power grasp task. (C) Actual hand trajectories and predictions using the day-0 decoder during the center-out (CO) reach task. Colors represent different reaching directions. (D) Actual and predicted hand trajectories using the day-0 decoder during the random-target (RT) reach task. Colors represent different reaching directions.

Figure 2—source data 1. Table summarizing the datasets analyzed in this paper, including cortical implant site and date, number of recording sessions, number of days between recording start and end, recording days relative to time of array implantation, and motor outputs (EMG or hand velocities) recorded.

Figure 2.

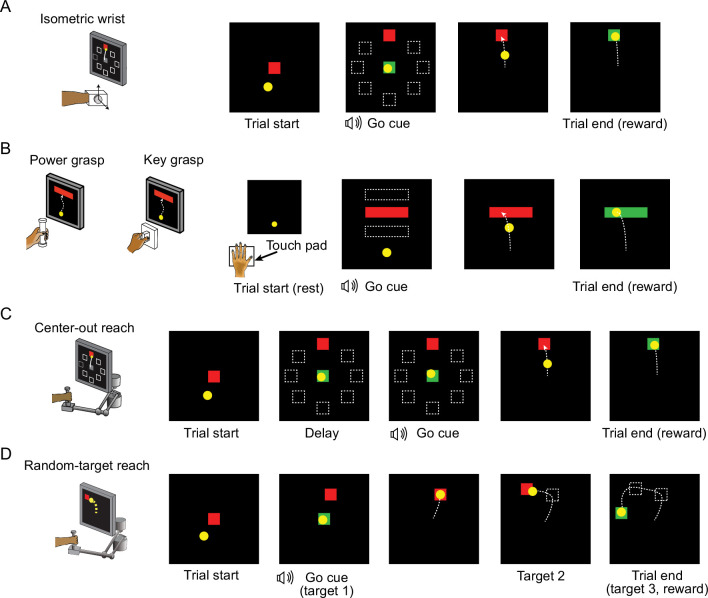
Figure 2—figure supplement 1. Behavior tasks.

Figure 2—figure supplement 1.

(A) The structure of the isometric wrist task. Each trial started with the appearance of a center target requiring the monkeys to hold for a random time (0.2–1.0 s), after which one of eight possible outer targets selected in a block-randomized fashion appeared, accompanied with an auditory go cue. The monkey was allowed to move the cursor to the target within 2.0 s and hold for 0.8 s to receive a liquid reward. (B) The structure of the grasping tasks. At the beginning of each trial the monkey was required to keep the hand resting on a touch pad for a random time (0.5–1.0 s). A successful holding triggered the onset of one of three possible rectangular targets on the screen and an auditory go cue. The monkey was required to place the cursor into the target and hold for 0.6 s by increasing and maintaining the grasping force applied on the gadget. (C) The structure of the center-out (CO) reach task. At the beginning of each trial, the monkey needed to move the hand to the center of the workspace. One of eight possible outer targets equally spaced in a circle was presented to the monkey after a random waiting period. The monkey needed to keep holding for a variable delay period until receiving an auditory go cue. To receive a liquid reward, the monkey was required to reach the outer target within 1.0 s and hold within the target for 0.5 s. (D) The structure of the random-target (RT) reach task. At the beginning of each trial the monkey also needed to move the hand to the center of the workspace. Three targets were then presented to the monkey sequentially, and the monkey was required to move the cursor into each of them within 2.0 s after viewing each target. The positions of these targets were randomly selected, thus the cursor trajectory for each trial presented a ‘random-target’ manner.
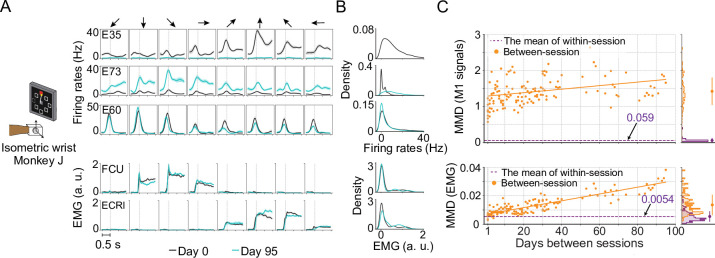
Figure 2—figure supplement 2. Unstable neural recordings underlying stable motor outputs.

Figure 2—figure supplement 2.

Data from monkey J, who was trained to perform the isometric wrist task. (A) Peri-event time histograms (PETHs) for the multiunit activity from three cortical electrodes (E35, E73, E60) and the EMGs from two forearm muscles (flexor carpi ulnaris, FCU; extensor carpi radialis longus, ECRl) on day 0 and day 95. Each column corresponds to a target direction indicated by the arrows on the top. For each direction, 15 trials were averaged to get the mean values (solid lines) and the standard errors (shaded area). The dashed vertical line in each subplot indicates the timing of force onset. While the neural activity picked by the implanted electrodes may change dramatically (E35, E73) or remain largely consistent (E95), the EMG patterns from two muscles which are critical to the task remain stable. (B) The distributions of the neural firing rates from E35, E73 and E60 and the EMGs from FCU and ECRl. The order of the subplots is consistent with (A). Note that for E35 the distribution of day-95 neural firing rates was omitted, since all values are close to 0. (C) The within-session and between-session maximum mean discrepancy (MMD) values for M1 signals (top panel) and EMGs (bottom panel). MMD provides a measure of distance between two multivariate distributions, and was used here to quantify the similarity of the distributions of neural activity or motor outputs between pairs of separate recording sessions in the dataset. In each panel the solid orange line shows a linear fit for all between-session MMDs, the dashed purple line indicates the mean of all within-session MMDs. The histograms for within-session and between-session MMDs are plotted on the right side of each panel, and the mean (solid dots) and standard deviation (solid lines) are shown. The between-session MMDs for M1 signals were an order of magnitude larger than for EMGs, and at least 10 times larger than the corresponding within-session values, indicating that instabilities in neural recordings are greater than in the motor output (note that the monkey was already well trained and proficient with the tasks before the data collection process began). However, factors such as monkey’s daily condition, noise levels of recordings, and drifts of the sensors on the behavioral apparatus could have altered the measured motor outputs across time and led to the reported gradual increase of the between-session MMDs for EMGs.
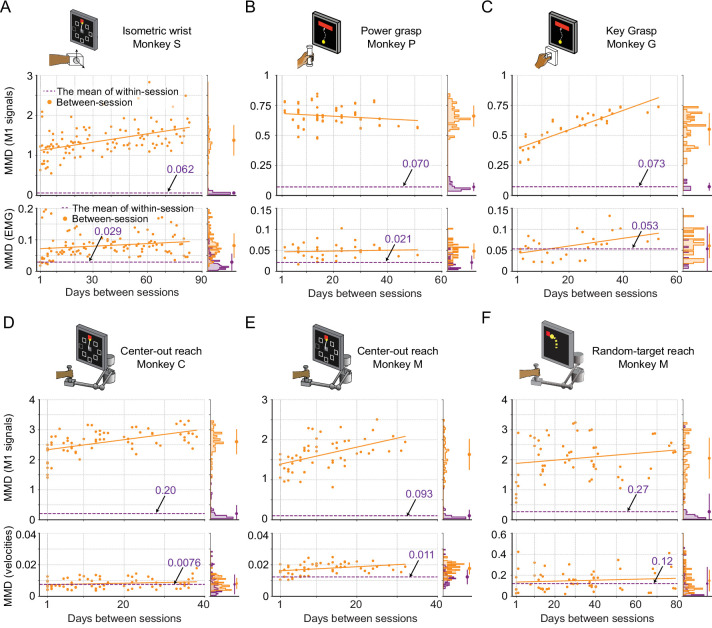
Figure 2—figure supplement 3. Evaluation of the stability of M1 neural signals and motor outputs over time for monkeys / tasks (besides monkey J).

Figure 2—figure supplement 3.

Stability is characterized by the discrepancy in the distributions of signals between pairs of recording sessions in each dataset, which are measured by maximum mean discrepancy (MMD). Each subplot corresponds to a dataset: isometric wrist task of monkey S (A), power grasp of monkey P (B), key grasp of monkey G (C), center-out reach of monkey C (D) and monkey M (E), and random-target reach of monkey M (F). In each subplot, we showed the between-session MMD (orange) for M1 signals (top panel) and motor outputs (either EMG or hand velocity, bottom panel), and indicated the mean value of the within-session MMDs using a dashed purple line. The histograms for within-session and between-session MMDs are plotted on the right side of each panel, and the mean (solid dots) and standard deviation (solid lines) are shown.
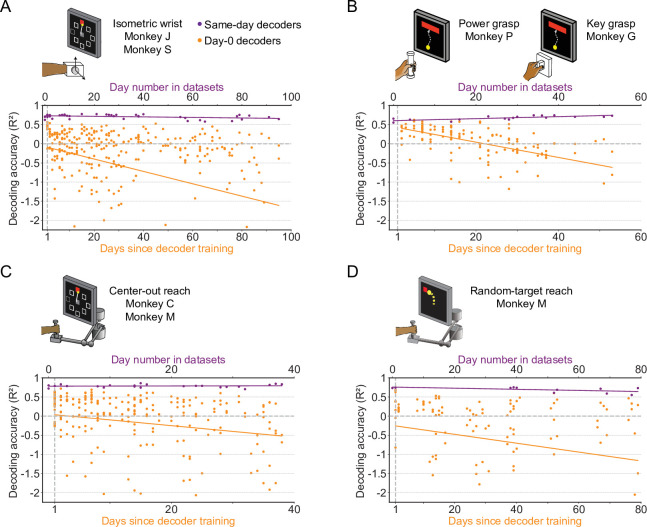
Figure 2—figure supplement 4. The accuracy of a well-calibrated iBCI decoder degrades over time for different behavioral tasks.

Figure 2—figure supplement 4.

We fit an iBCI decoder (Wiener filter) using the data collected on a specific day (day-0), and used this decoder to predict the motor outputs from M1 signals for all remaining days in a dataset (day-k). The performance of the decoder was evaluated by the R² value between the actual signals and the predictions. We used all available days in a dataset as the day-0 and repeated the same analysis for them. Each subplot corresponds to a behavioral task, and may contain the data from multiple monkeys: isometric wrist task of monkeys J and S (A), power and key grasp of monkeys P and G (B), center-out reach of monkeys M and C (C), random-target reach of monkey M (D). In each subplot, the R² values when using decoders to predict the motor outputs on the same day they were fit are shown (same-day decoders, purple). The x-axis on the top shows the number of the day which the recording session is on, where “0” corresponds to the earliest date in a dataset. The R² values when using decoders to predict the motor outputs on day-k are also shown (day-0 decoders, orange). The x-axis on the bottom shows the days since decoder training. The solid lines show linear fits for the R²s of the same-day decoders (purple) and day-0 decoders on day-k (orange).