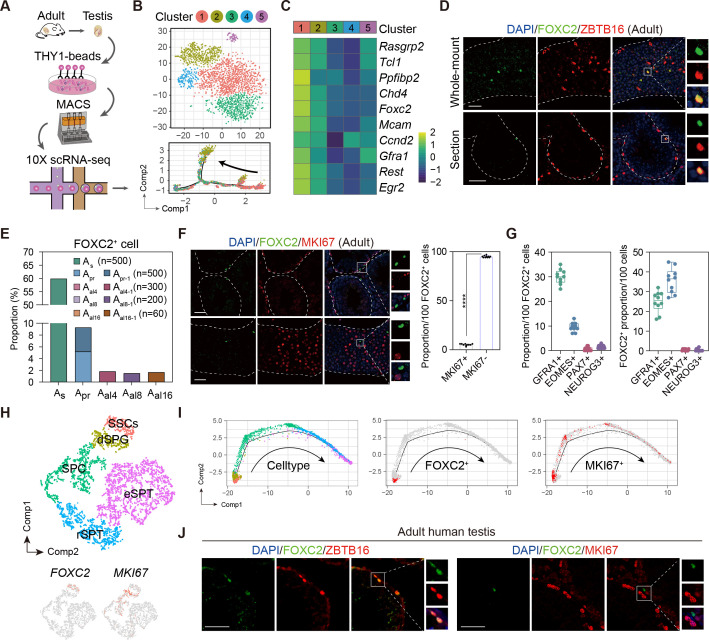
Figure 1. Identification of the FOXC2+ spermatogonial stem cells (SSCs) in adult mouse and human testis.
(A) Schematic illustration of the single-cell analysis workflow. (B) t-SNE plot and developmental trajectory of all undifferentiated spermatogonia (uSPG), colored by cluster. (C) Heatmap of the top 10 differentially expressed genes (DEGs) in Cluster1. (D) Immunostaining for ZBTB16 (red), FOXC2 (green), and DAPI (blue) in testicular paraffin sections from wild-type adult C57 mice. Scale bar, 50 μm; C57, C57BL/6J. (E) The proportion of FOXC2+ cells in different uSPG subtypes. (F) Immunostainings for MKI67 (red), FOXC2 (green), and DAPI (blue) in adult mice testis and the proportion of MKI67+ cells in FOXC2+ population (n=10). Scale bar, 50 μm; values, mean ± s.e.m.; p-values were obtained using two-tailed t-tests (****p-value <0.0001). (G) The co-expression proportion between the FOXC2 and differential known SSCs makers (n=10). (H) t-SNE plot of germ cells in adult human testis (GSE112013), colored by germ cell type. Feature plot showing the expression patterns of FOXC2 and MKI67 in human germ cells. (I) The developmental trajectory of the human germ cells, colored by germ cell type, FOXC2 expression cells (red), or MKI67 expression cells (red). (J) Immunostaining for ZBTB16/MKI67 (red), FOXC2 (green), and DAPI (blue) in testicular paraffin sections from adult humans.


