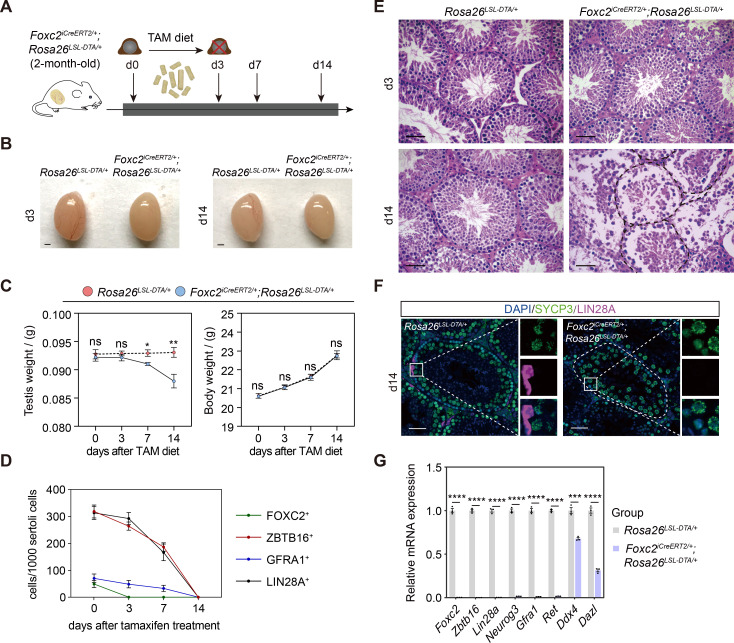
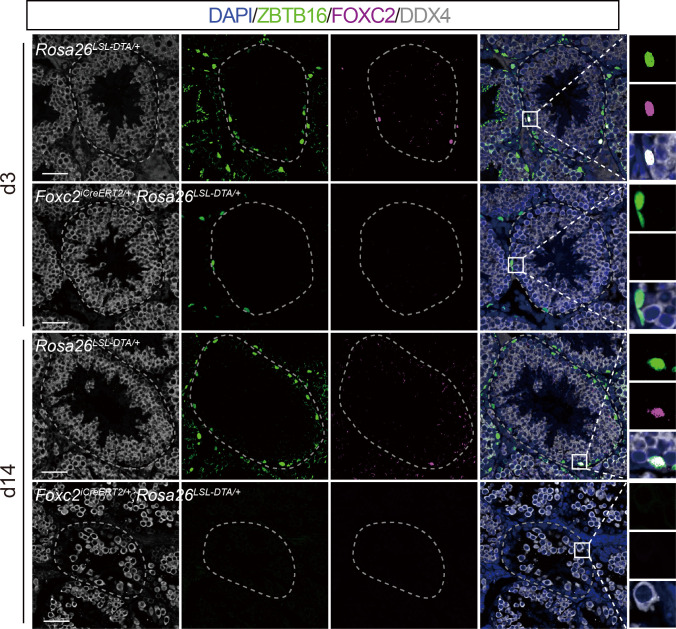
Figure 3. Specific ablation of FOXC2+ spermatogonial stem cells (SSCs) and phenotypic validation in Foxc2iCreERT2/+;Rosa26LSL-DTA/+ mice.
(A) Schematic illustration of the lineage tracing workflow for FOXC2+ cells. (B–D) Phenotypic validation of the Rosa26LSL-DTA/+ and Foxc2iCreERT2/+;Rosa26LSL-DTA/+ mice (n=5) for testes size (B), testis weight and body weight (C), and hematoxylin and eosin (HE) staining of the testes (D). Scale bars in (B), 1 mm; in (D), 50 μm; d, day; values were mean ± s.e.m.; p-values were obtained using two-tailed t-tests (ns >0.05, *p-value <0.05, **p-value <0.01). (E) ZBTB16+, GFRA1+, LIN28A+, and FOXC2+ SPG populations dynamics. Values, mean ± s.e.m. (n=10); p-values were obtained using one-way ANOVA followed by Tukey test (ns >0.05, *p-value <0.05, **p-value <0.01, ****p-value <0.0001). (F) Immunostainings for DAPI (blue), SYCP3 (green), and LIN28A (magenta) at day 14 post TAM induction. d, day; scale bar, 50 μm. (G) Quantitative RT-PCR analysis of SPG markers expression in the testes of the Rosa26LSL-DTA/+ and Foxc2iCreERT2/+;Rosa26LSL-DTA/+ mice (n=3). Values, mean ± s.e.m.; p-values were obtained using two-tailed t-tests (***p-value <0.001, ****p-value <0.0001).


