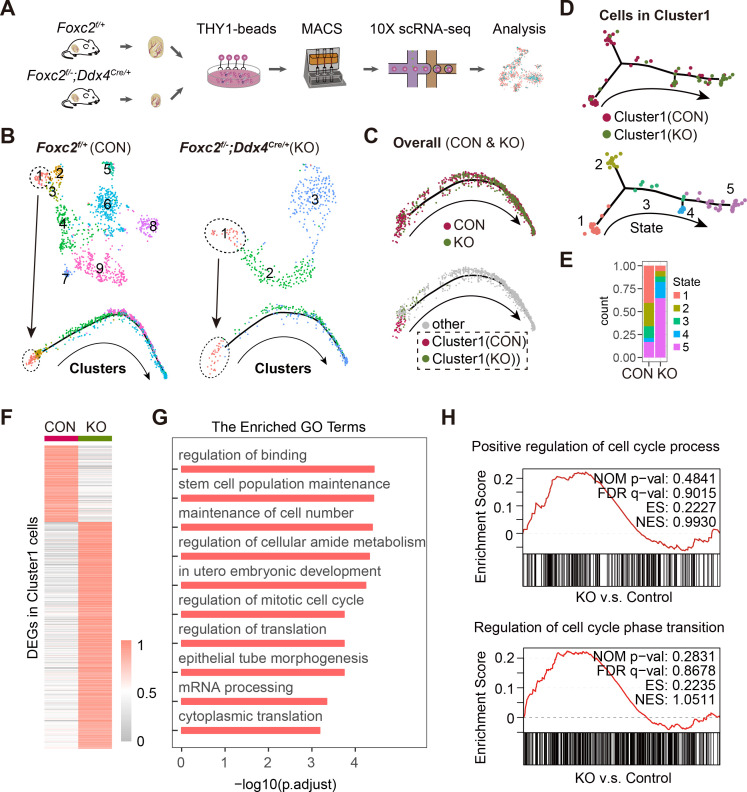
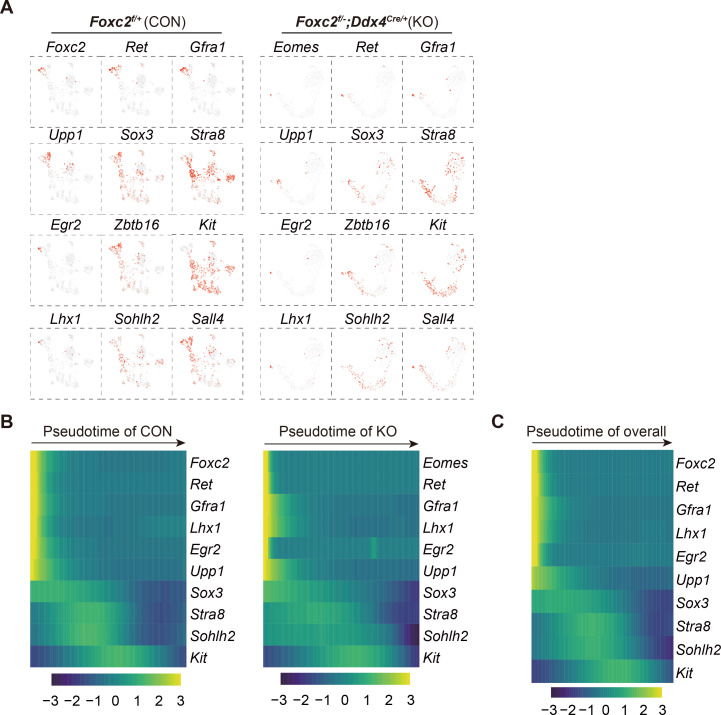
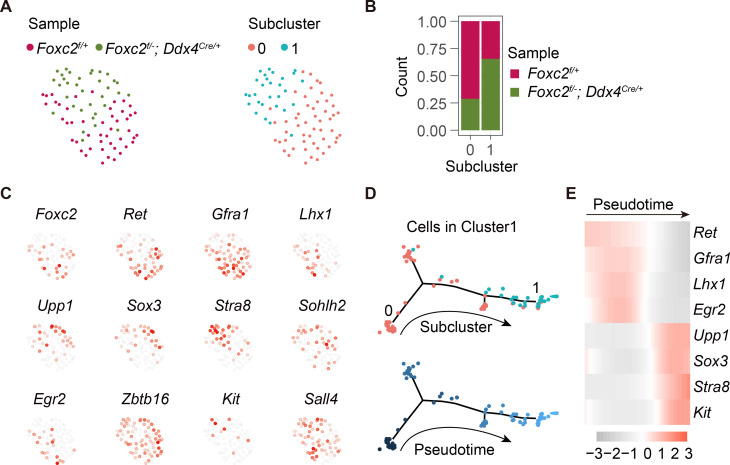
Figure 6. Single-cell RNA-sequencing (scRNA-seq) analysis of THY1+ undifferentiated spermatogonia (uSPG) in Foxc2f/+ and Foxc2f/-;Ddx4Cre/+ mice.
(A) Schematic illustration of the scRNA-seq workflow. (B) t-SNE plot and developmental trajectory of uSPG from Foxc2f/+ and Foxc2f/-;Ddx4Cre/+ mice, respectively, colored by cluster. (C) Developmental trajectories of uSPG from Foxc2f/+ and Foxc2f/-;Ddx4Cre/+ mice, colored by sample or derivation. (D) Developmental trajectories of the cells in Cluster1 from Foxc2f/+ (CON) and Foxc2f/-;Ddx4Cre/+ (KO) mice, colored by derivation or developmental state. (E) The Cluster1 cells proportion of each state in CON and KO mice. (F) Heatmap showing the differentially expressed genes (DEGs) in the Cluster1 cells from the Foxc2f/-;Ddx4Cre/+ mice compared with the Foxc2f/+ mice. (G) Top Gene Ontology (GO) terms enrichment by the down-regulated DEGs in KO mice. (H) Gene set enrichment analysis (GSEA) of the Cluster1 cells (Foxc2f/-;Ddx4Cre/+ v.s. Foxc2f/+ mice). NOM, nominal; FDR, false discovery rate; ES, enrichment score; NES, normalized enrichment score.


