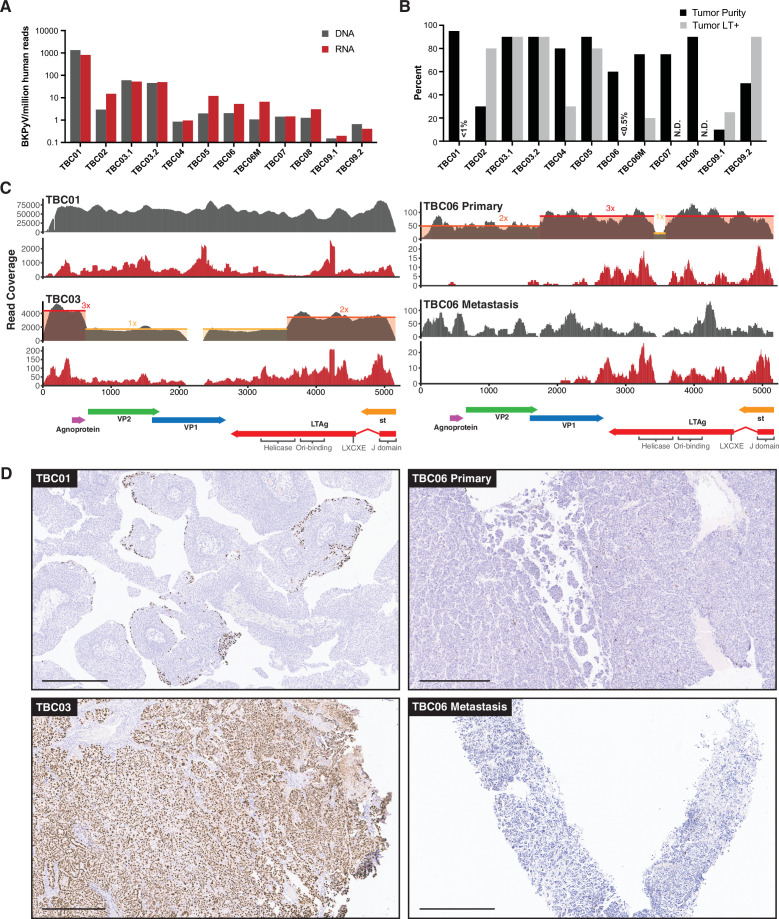
Figure 3. BK polyomavirus (BKPyV) DNA, RNA, and large T antigen (LTag) detection in tumors.
(A) Barplots showing the abundance of BKPyV DNA and RNA reads standardized to human reads (B) Barplots of histologically estimated percent tumor purity and Immunohistochemistry (IHC)-positivity for polyomavirus LTag expression. N.D. indicates no IHC image data were generated. (C) Representative coverage plots for BKPyV DNA (gray) and RNA (red) in BKPyV-positive tumors. Relative copy numbers are indicated by colored boxes and highlight the borders of duplications and deletions in the viral genome. (D) Selected images for LTag IHC highlighting positive staining for BKPyV-positive tumors with scale bars representing 500 microns.


