
Fig. 2.
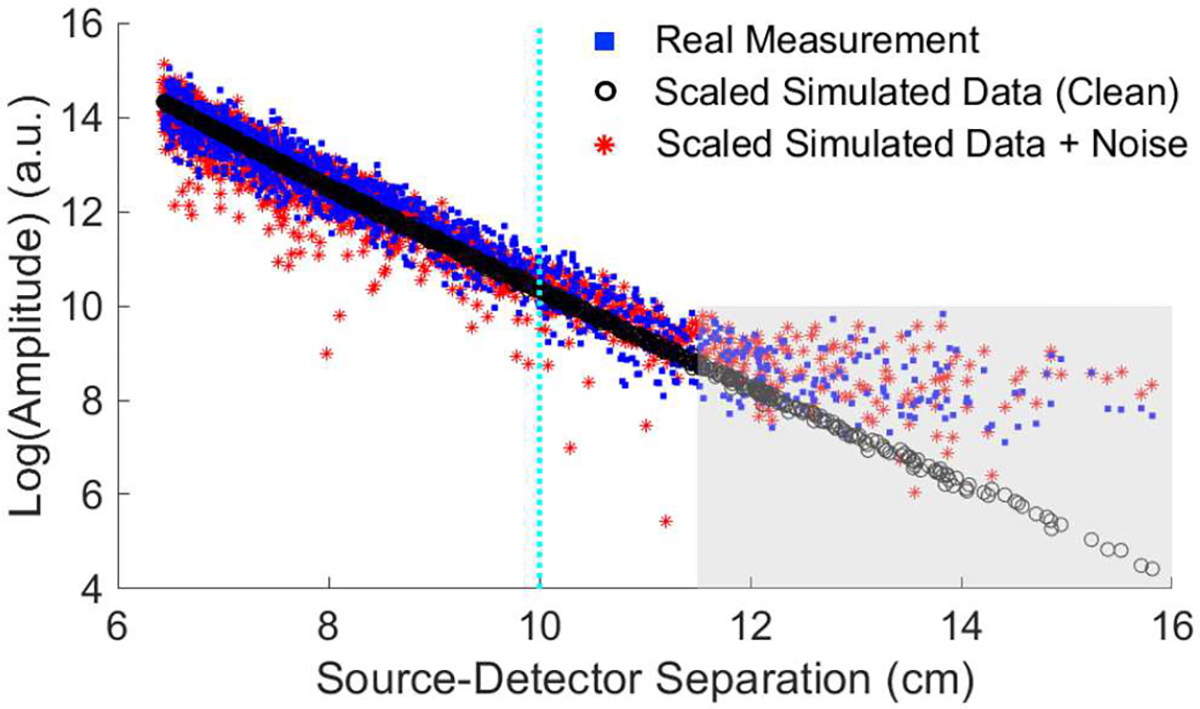
Plot of the signal amplitude of all 48×32 source-detector combinations versus the corresponding distances. Black circles: simulated data with only global scaling factor applied; Red stars: scaled simulated data with noise added; Blue squares: averaged real measurements of a homogeneous silicone rubber slab phantom; Gray shaded area: region reaching the noise floor; Cyan dotted line: the source-detector separation limit set for FEM-based methods.