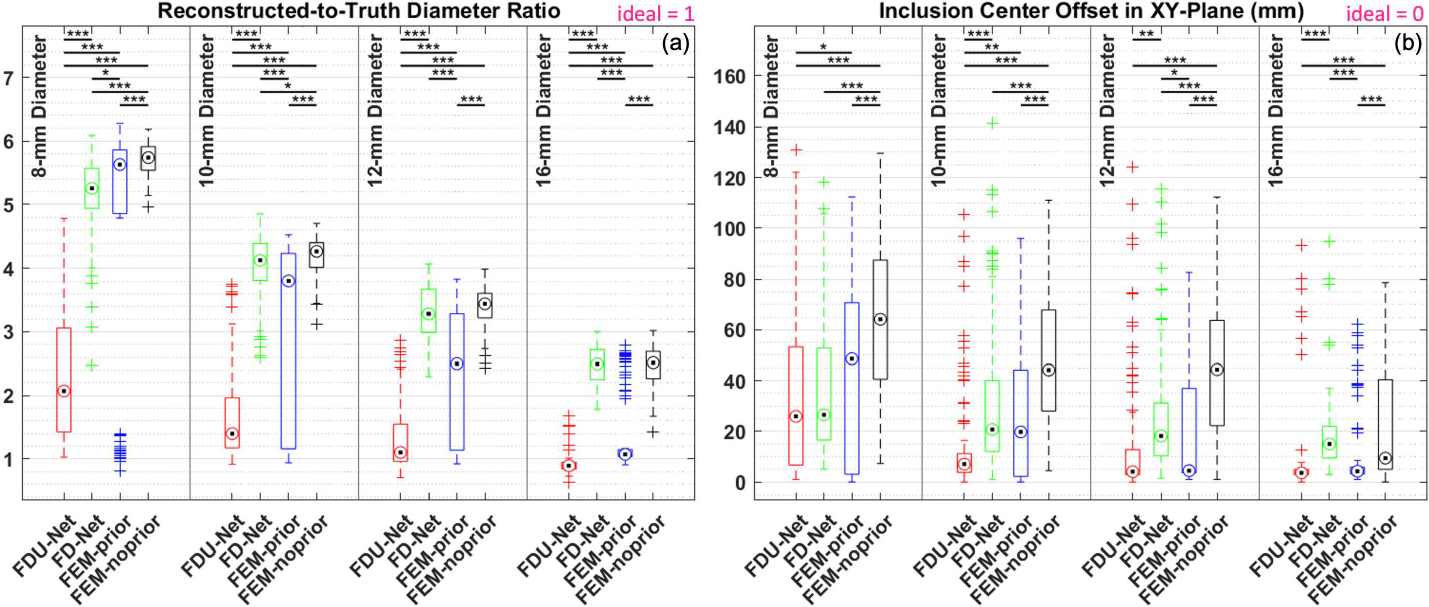
Fig. 7.

Box plot comparisons of inclusion size and localization accuracies in terms of (a) ratios of reconstructed inclusion diameter to ground-truth diameter, and (b) offsets of inclusion center from ground-truth centroid in XY-plane. The bottom and top edges of each box indicate the 25th and 75th percentiles, respectively. Target symbols – median. Significance bars of two-sided paired t-test between two methods: * p<0.05; ** p<0.01; *** p<0.001.
