

Abstract
Background
Inflammation in non‐small cell lung cancer (NSCLC) may impair the response to immune checkpoint inhibitors (ICIs) and can be indicated by peripheral blood inflammatory indexes. 2‐deoxy‐2‐[18F]fluoro‐D‐glucose positron emission tomography/computed tomography ([18F] FDG‐PET/CT) may be used as a marker of inflammation by measuring glucose metabolism in different colonic sites.
Methods
This retrospective analysis aimed to investigate the correlation between [18F] FDGPET/CT SUVratio in six gastrointestinal districts, the spleen, the pharynx and the larynx alongside the most avid tumor lesion with peripheral blood inflammatory indexes, including the neutrophil‐to‐lymphocyte ratio (NLR), systemic immune‐inflammatory index (SII, i.e., NLR times platelets) and lactate dehydrogenase (LDH), in patients with [18F] FDG‐PET/CT staged IV NSCLC who received first‐line immune checkpoint inhibitors (ICIs). The role of SUVratios and peripheral blood inflammatory indexes in predicting overall survival (OS) and progression‐free survival (PFS) was then explored.
Results
A total of 43 patients were treated with first‐line ICI alone (58%) or in combination with chemotherapy (42%). A significant correlation was only found between the rectosigmoid SUVratio and NLR (p = 0.0465). NLR >5.5 and LDH > 333.5 were associated with a worse OS (p = 0.033 and p = 0.009, respectively). The SII was associated with a worse PFS in patients treated with ICI alone (p = 0.033). None of the SUVratios were significantly associated with OS or PFS, although a high left colon SUVratio showed a trend toward a worse PFS.
Conclusion
There was no significant correlation between [18F]FDG PET/CT uptake in different anatomical sites, and in the tumor, and systemic immune‐inflammatory indexes. The prognostic role of high left colon SUVratio deserves further investigation.
Keywords: gut microbiome, immune checkpoint inhibitor, immunotherapy, lung cancer, NLR
Analysis of inflammation by [18F]FDG PET/CT and peripheral blood inflammatory indexes in NSCLC treated with ICIs revealed no correlation between [18F]FDG PET/CT uptakes and NLR, SII and LDH (with the exception of rectosigmoid and NLR) and worse prognosis when there was a high left colon SUVratio.

INTRODUCTION
Lung cancer is one of the most frequently diagnosed cancers and is still responsible for most cancer‐related deaths worldwide. 1 Traditionally, lung cancer is classified as non‐small cell lung cancer (NSCLC, 85%) and small cell lung cancer (SCLC, 15%). In recent years, several new drugs have been developed for NSCLC subtypes, leading to improvements in prognosis and quality of life.
Immune checkpoint inhibitors (ICIs) now represent the standard of care for advanced NSCLC, as single agents or combined with platinum‐based chemotherapy. They have been shown to enhance overall survival (OS) with a sustained response of 20% at four years. 2 Nevertheless, some patients experience severe immune‐related adverse events (irAEs) or primary resistance to these agents, so prognostic and predictive factors are needed to optimize patient selection. 3 , 4 , 5 , 6
Programmed cell death‐ligand‐1 (PD‐L1) is intuitively involved in responsiveness to anti‐PD(L)1 ICIs since it is directly involved in their mechanism of action. Therefore, it has been extensively considered and studied as a prognostic and predictive tool, alone or combined with other biomarkers. 7 Nevertheless, PD‐L1 predictions can be misleading since its tumor proportion score (TPS) sometimes seems uncorrelated with response to treatment. 8
Inflammation has been recognized as an adverse prognostic factor in lung cancer, 9 as several studies have shown it directly contributes to the development of metastases, angiogenesis, and immune escape. 10 Therefore, new indexes linked to peripheral inflammation have been investigated, such as the neutrophil‐to‐lymphocyte ratio (NLR), lactate dehydrogenase (LDH), platelet‐to‐lymphocyte ratio (PLR), and systemic immune‐inflammation index (SII) which is the result of the NLR multiplied by the platelet count. They are considered to be promising predictors for the use of ICIs in metastatic NSCLC. 11 , 12 , 13
The Food and Drug Administration (FDA) approved the biomarker known as tumor mutational burden (TMB), a measure of the number of mutations in a cancer, based on the cutoff of >10 mutations/megabase (mut/Mb). It performed majorly as a predictor of progression‐free survival (PFS) 8 , 14 and less so of OS. 6 Moreover, it showed inconsistency across clinical trials in NSCLC, particularly related to the undefined cutoff. 15 , 16 Its use is limited in clinical practice due to its high cost and limited specificity and sensitivity. 14
The gut microbiome (GM) has emerged as a prominent predictive biomarker. 17 Indeed, the heterogeneity of GM strongly correlates to ICI response, especially in renal cell cancer and melanoma. 5 The administration of antibiotic therapies and its effect on the GM in patients on ICIs is associated with both worse OS and response to treatment. 2 , 18 Since the microbes in the gastrointestinal tract interact with pattern recognition receptors (PRR) and their signaling cascades, abnormalities of GM have long‐term effects on immune response affecting ICIs efficacy by modulating immune response. In this context, it has been proven that higher microbial diversity is related to improved survival rates. 19
2‐deoxy‐2‐[18F] fluoro‐D‐glucose positron emission tomography/computed tomography ([18F] FDG PET/CT) can be used to detect inflammation by measuring glucose metabolism in different colonic sites and to characterize GM diversity. 2 Standardized uptake value (SUV) and metabolic tumor volume (MTV) are determined through threshold‐defined margin contouring. Median SUV multiplied by the MTV results in total lesion glycolysis (TLG), which expresses tumor metabolic activity and volumetric burden. We adopted the tumor‐to‐liver SUV ratio (SUVratio) as the best‐predicting parameter in comparison to SUVmax and tumor‐to‐blood SUVratio. 20 These imaging metrics on PET/CT have recently been acknowledged as effective tools in the monitoring of therapeutic response and prediction of prognosis with different cancers including NSCLC. 21 , 22 , 23
In this study, we first aimed to explore the correlation between the [18F] FDG PET/CT SUVratios in different healthy organs as well as in tumor lesions and peripheral blood inflammation indexes and second to assess their role in predicting OS and PFS of patients with advanced NSCLC treated with first‐line ICIs.
METHODS
Study objectives and endpoints
The primary study objective was to investigate the correlation between the physiological [18F]FDG‐PET/CT uptake (measured as SUVratio) in different anatomical sites and peripheral blood inflammation parameters through the Spearman's rank correlation test. Six gastrointestinal segments (i.e., stomach, cecum, right colon, transverse colon, left colon, rectosigmoid), spleen, pharynx and larynx were assessed alongside the SUVratio of the most [18F]FDG avid tumor lesions, the relative MTV and TLG. The overall colonic SUVratio was calculated as the median and average of the individual cecum, right colon, transverse colon, left colon and rectosigmoid measurements. The peripheral blood inflammation indexes investigated were the NLR, SII and LDH.
The secondary study objective was to explore by Cox regression univariable analysis whether any of the investigated districts or tumor SUVratios and the peripheral blood inflammation parameters were prognostic indicators of OS and PFS in the whole patient cohort and in particular, the cohort of patients treated with ICIs only (i.e., not combined with chemotherapy).
Study population and design
The patient cohort for the present retrospective analysis was derived from a consecutive series of patients with a cytological or histological diagnosis of NSCLC at clinical stage IV according to the eighth TNM edition, with available baseline [18F]FDG PET/CT imaging, without actionable genetic alterations and of any PD‐L1 tumor proportion score (TPS) and with any Eastern Cooperative Oncology Group Performance Status (ECOG PS), who had started first‐line ICI (i.e., pembrolizumab) alone or in combination with chemotherapy at the Candiolo Cancer Institute FPO‐IRCCS (Candiolo, Turin, Italy) between October 2018 and April 2022.
The following information was gathered from electronic medical records and the relative [18F]FDG PET/CT images: patient characteristics, tumor features, survival results, disease response, rates of treatment discontinuation and peripheral blood inflammatory indicators including the NLR, SII and LDH obtained from a peripheral blood test performed within 7 days of the treatment start date.
This analysis was registered and approved as an audit by the Clinical and Translational Lung Cancer Research Unit of Candiolo Cancer Center FPO‐IRCCS (CTLCRU‐02.22). Anonymized clinical data were used. The auditing process adhered to the Data Protection Act of 2018, the principles of the Declaration of Helsinki for all human and animal experimental research and the standards of Good Clinical Practice regarding the collection, storage, processing, and dissemination of personal information. The need for informed consent was waived.
[ 18F]FDG PET/CT imaging protocol and analysis
PET/CT scans were obtained employing Gemini TF tomograph (Philips Medical Systems) after intravenous administration of 150–320 MBq of [18F] FDG (3 MBq/kg; patients fasted for at least 6 h prior; glucose blood levels below 200 mg/dL at the time of administration). Every PET/CT scan was performed 60 ± 10 min after [18F]FDG injection; the acquisition started with a scout view (30 mA, 120 kV) followed by a low‐dose CT scan from the base of the skull to thighs (80 mAs, 120 kV, 3 mm slice thickness, 4‐mm table feed per rotation and 0.5 s per rotation). CT scan was used for both attenuation correction and anatomical localization of functional data. PET emission data were acquired in list mode at 90 s per bed position; PET images were reconstructed onto a 128 × 128 matrix using a BLOB‐OS‐TF algorithm (time of flight).
[18F]FDG PET/CT semiquantitative lesion and colonic analyses were performed by a single nuclear medicine physician blinded to all clinical information, using commercial software (Philips IntelliSpace Portal workstation version 5.0).
Concerning lesion analysis, the “hottest” tumor site was defined as the target lesion. In every patient's scan, a volume of interest (VOI) was manually drawn on the preconceived target lesion to measure the following parameters: SUVmax, SUVratio (defined as the ratio between the target lesion's SUVmax and SUVmean of the right lobe of the liver in a 30 cc VOI), MTV and TLG. Colon segmentation and contouring were performed according to the methods of a recent study published by Cetkovic et al. 2 Similar to the methods reported by Cetkovic et al., the colon was divided into its five anatomical segments (cecum, right, transverse, left and rectosigmoid) and every single portion was manually contoured based on axial CT coregistered images. Alongside the colonic segments, the pharynx, larynx and spleen were also contoured. Subsequently for each patient, a total of eight VOIs were drawn and SUVmax and SUVratio values were extracted for each site. Figure 1 shows an example of contouring.
FIGURE 1.
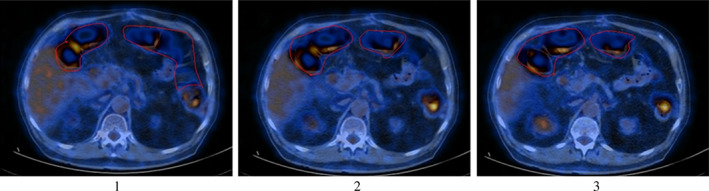
Example of transverse colon manual contouring on transaxial positron emission tomography/computed tomography (PET/CT) fused images. 1 , 2 , 3
Statistical analysis
Clinical data were analyzed using descriptive statistics with their respective dispersion values given, using percentages for binary variables and medians for continuous variables.
Correlation between variables was sought using the Spearman's rank correlation test.
The OS was calculated from the treatment start date to death or the date of the final follow‐up, whereas the PFS was computed from the treatment start date to disease progression or death from any cause. Patients who did not have any events at the time of the analysis were censored.
A receiver operating characteristic (ROC) curve analysis based on the progression of disease (PD) as the best response to treatment was conducted for each of the SUVratios and the peripheral blood inflammation indexes.
Although NLR, LDH and SII have literature‐reported cutoffs, 24 , 25 , 26 our study population was relatively small and selected by the availability of baseline [18F]FDG PET/CT scan; thus, we used the ROC analysis cutoffs as those values correspond better to this series of patients. The relative ROC‐derived cutoffs as well as the colonic median and average SUVratios, were used for the Cox regression univariable analysis assessing the OS and PFS with their related hazard ratios (HR) and 95% confidence intervals.
OS and PFS were also estimated using the Kaplan–Meier method and reported as medians with 95% confidence limits (95% CI) and compared using a two‐sided log‐rank test. A Cox regression univariable analysis on OS and PFS was conducted in the cohort of patients treated with ICIs only. For all the analyses, p < 0.05 was considered statistically significant.
The statistical analysis was carried out using the SigmaPlot software version 12.5 (Systat Software).
RESULTS
Patient characteristics and outcomes
A total of 43 patients with stage IV NSCLC and a median age of 67 years, treated with first‐line pembrolizumab alone (25, 58%) or in combination with chemotherapy (18, 42%), were retrospectively analyzed. None of the patients included in the study was receiving hypoglycemic therapy. The baseline characteristics are described in Table 1. A total of 27 patients (63%) had a high PD‐L1 (≥50%). The median NLR, SII and LDH values were 3.5, 1168 and 315, respectively. The colonic median SUVratio varied from 0.60 in the left colon to 1.01 in the rectosigmoid with an overall colonic median of 0.79 and an average of 0.92. The pharynx and larynx median SUVratio were 1.05 and 0.76, respectively. The tumor, MTV and TLG median SUVratio were 11.1, 34.6 and 288, respectively. With a median follow‐up of 18.2 months, the median PFS was 15.3 months (95% CI: 14.5–21.8), and the median OS was 25.6 months (95% CI: 15.0–21.8). Seven (16%) patients had PD as the best response to treatment.
TABLE 1.
The characteristics and outcomes in 43 patients.
| Characteristics | No. | % | Range |
|---|---|---|---|
| Age in years (median, IQR 25–75%) | 67 | 61–72 | |
|
Gender |
|||
| Male/female | 25/18 | 58/42 | |
|
Smoking history |
|||
| Never/former‐current smoker | 2/41 | 5/95 | |
|
Histology |
|||
| Squamous/adenocarcinoma/adenosquamous | 8/24/1 | 19/79/2 | |
|
ECOG PS |
|||
| 0/1/2 | 2/24/17 | 5/56/40 | |
|
Stage |
|||
| IVA/IVB | 17/26 | 40/60 | |
|
Metastatic sites |
|||
| ≥3/brain/liver | 12/9/4 | 28/21/9 | |
| PD‐L1 IHC (Ab 22C3) a | |||
| Negative (<1%)/Low (1–49%)/High (>50%) | 5/11/27 | 12/26/63 | |
| Oncogene EGFR/ALK/ROS1 | 0 | 0 | |
| Pretreatment steroids | 7 | 16 |
| Value | Range | |
|---|---|---|
| Peripheral blood inflammation indexes | ||
| NLR (median, IQR 25%–75%) | 3.5 | 2.6–5.7 |
| SII (median, IQR 25%–75%) | 1168 | 590–1829 |
| LDH (median, IQR 25%–75%) | 315 | 234–368 |
| PET SUV ratios (median, IQR 25%–75%) | ||
| Gastric | 0.90 | 0.75–1.01 |
| Cecum | 0.85 | 0.67–1.16 |
| Right colon | 0.78 | 0.62–1.01 |
| Transverse colon | 0.61 | 0.54–0.72 |
| Left colon | 0.60 | 0.45–0.77 |
| Rectosigmoid | 1.01 | 0.86‐1.21 |
| Spleen | 0.74 | 0.67–0.81 |
| Spleen/liver | 0.74 | 0.66–0.82 |
| Pharynx | 1.05 | 0.78–1.25 |
| Larynx | 0.76 | 0.65–0.91 |
| Tumor | 11.10 | 8.64–15.93 |
| MTV | 34.62 | 17.71–69.44 |
| TLG | 288.00 | 116.00–477.00 |
| Median of colonic values | 0.781 | 0.61–1.02 |
| Average of colonic values | 0.915 | 0.61–1.02 |
| Type of chemotherapy | No. | % | Range |
|---|---|---|---|
| Pembrolizumab only | 25 | 58 | |
| Pembrolizumab + chemotherapy | 18 | 42 | |
| Best response b | |||
| PR | 32 | 74 | |
| SD | 4 | 9 | |
| PD | 7 | 16 | |
| NA/treatment discontinuation | 0/7 | 0/16 | |
| Follow‐up, median, mo. [95% CI] | 18.2 | 14.5–21.8 | |
| OS, median, mo. [95% CI] | 25.6 | 15.0–36.2 | |
| PFS, median, mo. [95% CI] | 15.3 | 6.4–24.1 |
Abbreviations: Ab, antibody; CI, confidence interval; CR, complete response; ECOG PS, Eastern Cooperative Oncology Group Performance Status; IHC, immunohistochemistry; IQR, interquartile range; mo., months; LDH, lactate dehydrogenase; MTV, metabolic tumor volume; NA, not assessable; NLR, neutrophil‐to‐lymphocyte ratio; No., number; OS, overall survival; PET SUV, positron emission tomography standardized uptake value; PD‐L1, programmed cell death‐ligand‐1; PD, progressive disease; PFS, progression‐free survival; PR, partial response; SD, stable disease; SII, systemic immune‐inflammatory index; TLG, total lesion glycolysis; TPS, tumor proportion score.
Negative, TPS >1%; positive, TPS 1–49%; high, TPS ≥50%.
Referring to RECIST version 1.1 criteria.
Correlation between SUVratios and peripheral blood inflammation indexes
The correlation between the metabolic parameters of the different organs and the tumor lesions, and peripheral blood inflammation indexes is shown in Table 2. Two significant correlations were found between rectosigmoid SUVratio and NLR (p = 0.0465), and between MTV and SII (p = 0.0249). Gastric SUVratio and LDH showed a nonsignificant correlation trend (p = 0.0549). No other significant correlations were found including between the overall colonic SUVratio average and NLR, SII or LDH (p = 0.627, p = 0.731 and p = 0.531, respectively).
TABLE 2.
Correlation between SUVratios and peripheral blood inflammation indexes.
| Gastric | Cecum | Right colon | Transverse colon | Left colon | Rectosigmoid | Spleen | Spleen to liver | Pharynx | Larynx | Tumor | MTV | TLG | Overall colonic | |
|---|---|---|---|---|---|---|---|---|---|---|---|---|---|---|
| NLR | ||||||||||||||
| Correlation coefficient | 0.075 | 0.0667 | −0.0272 | −0.0889 | −0.185 | −0.305 | 0.0261 | −0.00545 | 0.0991 | −0.072 | 0.245 | 0.266 | 0.241 | −0.0304 |
| p‐value | 0.635 | 0.669 | 0.862 | 0.569 | 0.234 | 0.0465 | 0.867 | 0.972 | 0.525 | 0.644 | 0.113 | 0.0846 | 0.118 | 0.627 |
| Number of samples | 42 | 43 | 43 | 43 | 43 | 43 | 43 | 43 | 43 | 43 | 43 | 43 | 43 | 257 |
| SII | ||||||||||||||
| Correlation coefficient | 0.0117 | 0.0974 | −0.0403 | −0.0664 | −0.05 | −0.193 | −0.096 | −0.121 | 0.102 | 0.063 | 0.256 | 0.342 | 0.235 | 0.0215 |
| p‐value | 0.94 | 0.532 | 0.796 | 0.67 | 0.749 | 0.215 | 0.538 | 0.436 | 0.512 | 0.687 | 0.0978 | 0.0249 | 0.128 | 0.731 |
| Number of samples | 42 | 43 | 43 | 43 | 43 | 43 | 43 | 43 | 43 | 43 | 43 | 43 | 43 | 257 |
| LDH | ||||||||||||||
| Correlation coefficient | −0.298 | −0.173 | 0.238 | 0.077 | 0.0217 | −0.113 | −0.128 | −0.0506 | −0.105 | −0.0331 | −0.0682 | −0.194 | −0.0811 | −0.0392 |
| p‐value | 0.0549 | 0.267 | 0.123 | 0.622 | 0.889 | 0.468 | 0.41 | 0.746 | 0.501 | 0.832 | 0.662 | 0.212 | 0.603 | 0.531 |
| Number of samples | 42 | 43 | 43 | 43 | 43 | 43 | 43 | 43 | 43 | 43 | 43 | 43 | 43 | 257 |
Abbreviations: LDH, lactate dehydrogenase; MTV, metabolic tumor volume; NLR, neutrophil‐to‐lymphocyte ratio; SII, systemic immune‐inflammatory index; SUVratios, standardized uptake value ratios; TLG, total lesion glycolysis.
ROC‐derived cutoffs for SUVratios and peripheral blood inflammation indexes
No statistical significance was reached for any of the metabolic parameters or the peripheral blood inflammation indexes. Among the colonic SUVratios, the left colon reached the highest sensitivity (85.7%) with a cutoff of 0.54 and the cecum had the highest combined sensitivity/specificity (71.4/61.1%) with a cutoff of 0.89. Out of other SUVratios, the pharynx showed the highest sensitivity/specificity values (71.4/72.2%) with a cutoff of 1.12. Among the three peripheral blood inflammation indexes, the NLR was the best performer for sensitivity/specificity (71.4/80.6%) with a cutoff of 5.5.
Univariable analysis on overall survival
Statistical significance by Cox regression univariable analysis on OS was reached for NLR ≥5.5 (HR = 3.37, 95% CI: 1.10–10.32, p = 0.033) and LDH ≥333.5 (HR = 4.82, 95% CI: 1.48–15.68, p = 0.009) but not for SII ≥1235 (HR = 1.47, 95% CI: 0.51–4.24, p = 0.033). Among the [18F]FDG‐PET/CT SUVratios, that of the left colon stood out at ≥0.54 but this did not reach statistical significance (HR = 2.74, 95% CI: 0.76–9.83, p = 0.123). Notably, the SUVratio of the tumor, MTV and TLG did not significantly affect the OS with the TLG ≥207.5 even showing a potentially protective role (HR = 0.59, 95% CI: 0.20–1.70, p = 0.328) (see Table 3).
TABLE 3.
Univariable Cox regression model on OS and PFS according to ROC curve‐based cutoffs.
| OS | PFS | |||||||
|---|---|---|---|---|---|---|---|---|
| HR | 95% CI‐L | 95% CI‐U | p‐value | HR | 95% CI‐L | 95% CI‐U | p‐value | |
| Gastric | 0.98 | 0.34 | 2.83 | 0.968 | 0.99 | 0.43 | 2.31 | 0.987 |
| Cecum | 1.81 | 0.62 | 5.29 | 0.280 | 2.12 | 0.92 | 4.88 | 0.076 |
| Right colon | 1.30 | 0.43 | 3.90 | 0.644 | 1.88 | 0.82 | 4.30 | 0.138 |
| Transverse | 1.63 | 0.51 | 5.23 | 0.408 | 1.14 | 0.48 | 2.72 | 0.771 |
| Left colon | 2.74 | 0.76 | 9.83 | 0.123 | 2.53 | 0.99 | 6.49 | 0.053 |
| Rectosigmoid | 1.28 | 0.43 | 3.84 | 0.660 | 1.23 | 0.53 | 2.84 | 0.632 |
| Spleen | 1.04 | 0.36 | 3.00 | 0.948 | 1.11 | 0.48 | 2.53 | 0.810 |
| Spleen to liver | 1.03 | 0.36 | 2.93 | 0.961 | 1.25 | 0.55 | 2.83 | 0.599 |
| Pharynx | 1.63 | 0.56 | 4.70 | 0.369 | 1.67 | 0.71 | 3.91 | 0.238 |
| Larynx | 0.67 | 0.23 | 1.96 | 0.465 | 0.51 | 0.22 | 1.20 | 0.121 |
| Tumor | 0.81 | 0.28 | 2.36 | 0.703 | 0.85 | 0.37 | 1.93 | 0.691 |
| MTV | 1.24 | 0.43 | 3.59 | 0.692 | 1.10 | 0.47 | 2.55 | 0.827 |
| TLG | 0.59 | 0.20 | 1.70 | 0.328 | 1.12 | 0.49 | 2.55 | 0.795 |
| Colonic median | 0.86 | 0.30 | 2.50 | 0.786 | 1.44 | 0.62 | 3.33 | 0.399 |
| Colonic average | 1.39 | 0.46 | 4.20 | 0.560 | 2.21 | 0.96 | 5.09 | 0.063 |
| NLR | 3.37 | 1.10 | 10.32 | 0.033 | 1.61 | 0.65 | 3.99 | 0.306 |
| SII | 1.47 | 0.51 | 4.24 | 0.472 | 1.82 | 0.78 | 4.26 | 0.167 |
| LDH | 4.82 | 1.48 | 15.68 | 0.009 | 1.61 | 0.68 | 3.81 | 0.275 |
Abbreviations: CI‐L, confidence interval‐lower; CI‐U, confidence interval‐upper; HR, hazard ratio; LDH, lactate dehydrogenase; MTV, metabolic tumor volume; NLR, neutrophil‐to‐lymphocyte ratio; OS, overall survival; PFS, progression‐free survival; ROC, receiver operating characteristic; SII, systemic immune‐inflammatory index; TLG, total lesion glycolysis.
Log‐rank test confirmed statistical significance for NLR and LDH (p = 0.024 and p = 0.004, respectively) and a nonsignificant trend for left colon SUVratio (p = 0.108). The relative Kaplan–Meier curves showed worse OS in patients with baseline NLR ≥5.5, LDH ≥333.5 and left colon SUVratio ≥0.54 (see Figure 1).
The results of the Cox regression univariable analysis on OS were consistent in the subgroup of patients treated with ICI alone, with significant changes with NLR and LDH (HR = 4.96, 95% CI: 1.18–20.84, p = 0.029 and HR = 6.19, 95% CI: 1.47–26.18, p = 0.013, respectively) and a nonsignificant trend for left colon SUVratio (HR = 3.54, 95% CI: 0.73–17.10, p = 0.116) (see Table S1).
Univariable analysis on progression‐free survival
By Cox regression univariable analysis on PFS, none of the included metabolic parameters and peripheral blood inflammation indexes reached statistical significance including NLR ≥5.5 and LDH ≥333.5, whereas the left colon SUVratio showed borderline statistical significance (HR = 2.53, 95% CI: 0.99–6.49, p = 0.053). The colonic average and cecum SUVratios also showed nonsignificant trends (p = 0.063 and p = 0.076, respectively) (see Figure 1).
Log‐rank test for NLR, LDH and left colon SUVratio revealed the left colon as the only significant factor for PFS (p = 0.045). The Kaplan–Meier curves showed worse OS in patients with baseline NLR ≥5.5, LDH ≥333.5 and left colon SUVratio ≥0.54 (see Figure 2).
FIGURE 2.
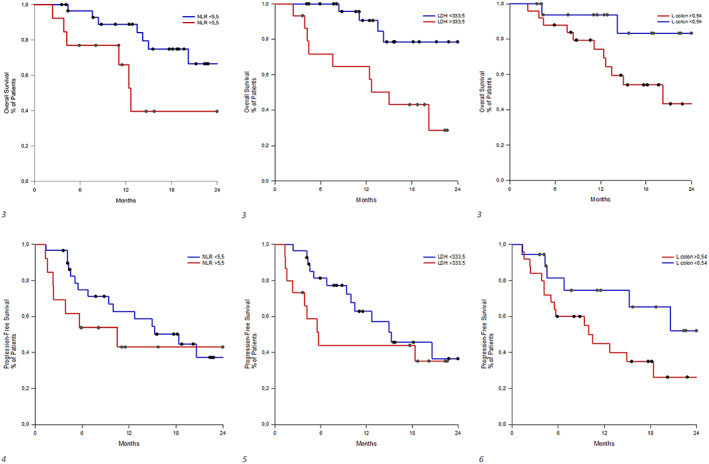
Kaplan–Meier from univariable Cox regression model on OS (1, 2, 3) and on PFS (4, 5, 6) according to receiver operating characteristic (ROC) curve‐based cutoff. CI‐L, confidence interval‐lower; CI‐U, confidence interval‐upper; No., number; NLR, neutrophil‐to‐lymphocyte ratio; OS, overall survival; PFS, progression‐free survival; SII, systemic immune‐inflammatory index.
The above findings were consistent with Cox regression univariable analysis on PFS in the subgroup of patients treated with ICI alone with the left colon SUVratio improving its discrimination in comparison to the OS analysis (HR = 2.89, 95% CI: 0.90–9.33, p = 0.075). Notably, the SII was the only peripheral blood inflammation index reaching statistical significance in this subgroup (HR = 3.44, 95% CI: 1.10–10.75, p = 0.033) (see Table S2).
DISCUSSION
In our study, we retrospectively collected data from patients with stage IV NSCLC treated with ICIs alone or combined with chemotherapy with available baseline [18F]FDG PET/CT imaging, focusing on baseline peripheral blood inflammatory indexes (NLR, SII and LDH values) and [18F]FDG uptake in different anatomical sites suggestive of inflammation, particularly in gastrointestinal‐respiratory tracts, spleen, and in the tumor (e.g., SUVratio of MTV and TLG of the most avid lesion).
The study aimed to investigate a correlation between SUVmax ratios and peripheral blood inflammatory indicators and their association with survival outcomes.
The median OS in our series was 25.6 months, while the median PFS was 15.3 months which was in line with, or even longer than, that reported in similar immunotherapy clinical trials. In the KEYNOTE−024 27 trial, patients with high PD‐L1 treated with pembrolizumab alone had a median OS of 26.3 months and PFS of 10.3 months. In the KEYNOTE‐189 28 trial, pembrolizumab and chemotherapy yielded a median OS of 22.0 months and PFS of 9.0 months with any PD‐L1 expression, while those were 17.1 months and 8.0 months, respectively in the KEYNOTE‐407 29 trial in patients with squamous NSCLC. The relatively more favorable survival outcomes observed might be explained by the positive selection of patients with available [18F]FDG PET/CT at the baseline because the analyzed population was characterized by 40% of patients with stage IVA disease.
We did not find a significant correlation between NLR, SII or LDH and the SUVratio in different sites and the tumor except for a negative correlation between NLR and rectosigmoid SUVratio and a positive correlation between MTV and SII. These results may have been due to chance. In particular, the MTV is not an expression of tumor burden (like the TLG), and only a nonsignificant correlative trend was detected with the NLR, which undermines SII. These findings might suggest the lack of a relationship between chronic inflammatory conditions expressed by the SUVratio and the acute or subacute immune‐inflammatory response detected by peripheral blood inflammatory indexes.
We confirmed the prognostic role of NLR with cutoff >5.5 and LDH >335.6 with OS both in the overall cohort and in the exploratory subgroup of patients treated with ICI only. However, we are unable to confirm this for the SII with regards to OS, and none of the peripheral blood inflammatory indexes for PFS. This was likely attributable to the relatively small sample size and a low number of events (i.e., disease progressions).
Several peripheral blood inflammatory indexes (such as the NLR, SII, albumin ratio and LDH) have been investigated and confirmed as baseline prognostic indicators for patients with NSCLC receiving ICIs alone or in association with chemotherapy in retrospective and prospective studies. 9 Some of these have been grouped in prognostic models which include other clinical factors or different biomarkers such as the LIPI score (based on derived NLR and LDH), 30 Cortellini score (NLR and PD‐L1), 31 LIPS‐3 score (NLR, ECOG and steroids), 32 Gustave Roussy immune score (LDH, albumin and NLR), 33 and Royal Marsden Hospital Prognostic score (LDH, albumin and the number of metastatic sites). 34
Inflammation is an intrinsic part of most malignancies which affects the immune response by altering the tumor microenvironment and influencing neo‐antigen presentation by T cells. 35 , 36
Interestingly, a positive association between SII and PFS emerged in the ICI‐only exploratory subgroup confirming that the role of peripheral blood systemic inflammation indexes may be more implicated in ICI response and partially masked by the addition of the chemotherapy. 31 The persistence of inflammation may be one of the reasons for ICI failure because of the production of cytokines and alteration of oxidative stress and glycolytic metabolic pathways, which subsequently interfere with T cell activation. 37 This serves as a rationale for clinical trials combining ICIs with cytokine inhibitors such as IFN‐α and IL‐2. 38
We did not find a statistically significant association between metabolic parameters of different anatomical sites or the tumor lesions and OS or PFS.
Evidence has accumulated highlighting the influential role of GM on ICI response. Derosa et al. collected fecal samples of 70 patients affected by NSCLC treated with ICIs alone. Patients with a worse prognosis had different gut microbial compositions than those with a good prognosis. 18 Furthermore, a different gut composition was found in patients with IrAEs and receiving antibiotic therapy. The [18F]FDG colonic uptake was then investigated as a potential predictor of physiological or inflammatory patterns underpinned by different gut compositions. In a retrospective series of 71 patients with advanced NSCLC treated with ICIs alone (27 patients) or in combination with chemotherapy, patients with higher than average colon SUVmax had a significantly shorter PFS but not OS than those with lower values. Within the higher‐than‐average SUVmax group, patients with higher‐than‐average cecum SUVmax showed significantly shorter PFS and a nonsignificant trend toward shorter OS compared to the low cecum SUV uptake group. None of the other analyses relative to the right, transverse, left and rectosigmoid colon SUVmax reached statistical significance. Metagenomic sequencing revealed distinctive higher microbiome diversity and distinctive composition in patients with low cecum SUVmax. 2 This corroborated evidence that GM diversity may be a consequence of colon inflammation and an emerging biomarker to predict ICI response. 2
In our cohort, numerically smaller than the above‐mentioned study, particularly in patients treated exclusively with ICIs, we could not find a significant association between the SUVratios of any of the colonic or other districts and tumor lesions with survival outcomes, although a shorter OS and PFS were observed particularly in patients with a high left colon uptake, and a nonsignificant trend toward worse outcomes was confirmed in those with a high overall colonic uptake, measured by the average of the six colonic districts and the cecum. This diversity might probably be due to the relatively limited sample size in both series, the different applied methodologies in the two studies to detect the [18F]FDG colonic uptake and different treatment settings. In our analysis, we used ROC‐derived cutoffs instead of average values and analyzed each colonic district by avoiding subgrouping in the two categories of higher‐ and lower‐than‐average overall colonic SUVmax group. Furthermore, in our study, all analyzed patients were treated in a first‐line setting, not in different treatment lines but patients treated with ICIs only were less represented.
Notably, the overall colonic and left colon uptakes did not correlate with any of the peripheral blood inflammatory indexes. Thus, if their prognostic value were to be confirmed in a larger series, they will likely represent new independent predictors of outcome to ICIs.
As already discussed above, the major limitations of our study were the relatively small sample size, the possible positive selection of patients with available baseline PET with 40% of patients with stage IVA disease enrolled and the likely consequent low incidence of events or disease progression.
In conclusion, our study suggests the lack of a relationship between chronic inflammatory conditions expressed by the PET metabolic parameters and the systemic immune‐inflammatory status represented by peripheral blood inflammatory indexes in patients with NSCLC treated with first‐line ICIs alone or in combination with chemotherapy. Our opinion is that the prognostic role of the overall colonic and particularly the left colon uptake deserves further investigation in larger prospective clinical series, as based on our data they could likely represent new independent predictors of outcome to ICIs.
AUTHOR CONTRIBUTIONS
All authors contributed to writing the manuscript. All authors revised and approved the final version of the manuscript.
CONFLICT OF INTEREST STATEMENT
Giuseppe Luigi Banna reports personal fees from AstraZeneca, Astellas, travel and conference expenses from Janssen, outside the submitted work. Vanesa Gregorc declared consultant/advisor's fees from Boehringer Ingelheim, Bistol Myear Squibb, and Janssen outside the submitted work. Silvia Novello declared speaker bureau/advisor's fee from Eli Lilly, MSD, Roche, Bristol Myer Squibb, Amgen, Takeda, Pfizer, Thermo Fisher Scientific, Astra Zeneca and Boehringer Ingelheim outside the submitted work. The other authors have nothing to declare.
Supporting information
Table S1. ROC‐derived cutoffs for the SUVratios and peripheral blood inflammation indexes.a.
Table S2. Univariable Cox regression model on OS and PFS according to ROC‐based cutoffs only immunotherapy (n = 25).
ACKNOWLEDGMENT
This work has been supported by FPRC 5xmille 2019 Ministero Salute ‐ Candiolo Cancer Institute, progetto IDEE‐OLIGOMET.
Rizzo A, Cantale O, Mogavero A, Garetto L, Racca M, Venesio T, et al. Assessing the role of colonic and other anatomical sites uptake by [18F]FDG‐PET/CT and immune‐inflammatory peripheral blood indexes in patients with advanced non‐small cell lung cancer treated with first‐line immune checkpoint inhibitors. Thorac Cancer. 2023;14(24):2473–2483. 10.1111/1759-7714.15032
Silvia Novello, Vanesa Gregorc and Giuseppe Luigi Banna are co‐last authors.
REFERENCES
- 1. Thai AA, Solomon BJ, Sequist LV, Gainor JF, Heist RS. Lung cancer. Lancet. 2021;398(10299):535–554. 10.1016/S0140-6736(21)00312-3 [DOI] [PubMed] [Google Scholar]
- 2. Cvetkovic L, Régis C, Richard C, Derosa L, Leblond A, Malo J, et al. Physiologic colonic uptake of 18F‐FDG on PET/CT is associated with clinical response and gut microbiome composition in patients with advanced non‐small cell lung cancer treated with immune checkpoint inhibitors. Eur J Nucl Med Mol Imaging. 2021;48(5):1550–1559. 10.1007/s00259-020-05081-6 [DOI] [PubMed] [Google Scholar]
- 3. Oh B, Boyle F, Pavlakis N, Clarke S, Eade T, Hruby G, et al. The gut microbiome and cancer immunotherapy: can we use the gut microbiome as a predictive biomarker for clinical response in cancer immunotherapy? Cancer. 2021;13(19):4824. 10.3390/cancers13194824 [DOI] [PMC free article] [PubMed] [Google Scholar]
- 4. Doroshow DB, Sanmamed MF, Hastings K, Politi K, Rimm DL, Chen L, et al. Immunotherapy in non‐small cell lung cancer: facts and hopes. Clin Cancer Res. 2019;25(15):4592–4602. 10.1158/1078-0432.CCR-18-1538 [DOI] [PMC free article] [PubMed] [Google Scholar]
- 5. Banna GL, Passiglia F, Colonese F, Canova S, Menis J, Addeo A, et al. Immune‐checkpoint inhibitors in non‐small cell lung cancer: a tool to improve patients' selection. Crit Rev Oncol Hematol. 2018;129:27–39. 10.1016/j.critrevonc.2018.06.016 [DOI] [PubMed] [Google Scholar]
- 6. Friedlaender A, Bauml J, Banna GL, Addeo A. Identifying successful biomarkers for patients with non‐small‐cell lung cancer. Lung Cancer Manage. 2019;8(3):LMT17. 10.2217/lmt-2019-0009 [DOI] [PMC free article] [PubMed] [Google Scholar]
- 7. Banna GL, Signorelli D, Metro G, Galetta D, De Toma A, Cantale O, et al. Neutrophil‐to‐lymphocyte ratio in combination with PD‐L1 or lactate dehydrogenase as biomarkers for high PD‐L1 non‐small cell lung cancer treated with first‐line pembrolizumab. Transl Lung Cancer Res. 2020;9(4):1533–1542. 10.21037/tlcr-19-583 [DOI] [PMC free article] [PubMed] [Google Scholar]
- 8. Ling T, Zhang L, Peng R, Yue C, Huang L. Prognostic value of 18F‐FDG PET/CT in patients with advanced or metastatic non‐small‐cell lung cancer treated with immune checkpoint inhibitors: a systematic review and meta‐analysis. Front Immunol. 2022;13. 10.3389/fimmu.2022.1014063 [DOI] [PMC free article] [PubMed] [Google Scholar]
- 9. Rebuzzi SE, Prelaj A, Friedlaender A, Cortellini A, Addeo A, Genova C, et al. Prognostic scores including peripheral blood‐derived inflammatory indices in patients with advanced non‐small‐cell lung cancer treated with immune checkpoint inhibitors. Crit Rev Oncol Hematol. 2022b;179:103806. 10.1016/j.critrevonc.2022.103806 [DOI] [PubMed] [Google Scholar]
- 10. Tan Z, Xue H, Sun Y, Zhang C, Song Y, Qi Y. The role of tumor inflammatory microenvironment in lung cancer. Front Pharmacol. 2021;12. 10.3389/fphar.2021.688625 [DOI] [PMC free article] [PubMed] [Google Scholar]
- 11. Banna GL, Basso U, Giunta EF, Fratino L, Rebuzzi SE, Buti S, et al. The geriatric G8 score is associated with survival outcomes in older patients with advanced prostate cancer in the ADHERE prospective study of the meet‐URO network. Curr Oncol. 2022;29(10):7745–7753. 10.3390/curroncol29100612 [DOI] [PMC free article] [PubMed] [Google Scholar]
- 12. Dirican N, Dirican A, Anar C, Atalay S, Ozturk O, Bircan A, et al. A new inflammatory prognostic index, based on C‐reactive protein, the neutrophil to lymphocyte ratio and serum albumin is useful for predicting prognosis in non‐small cell lung cancer cases. Asian Pac J Cancer Prevent: APJCP. 2016;17(12):5101–5106. 10.22034/APJCP.2016.17.12.5101 [DOI] [PMC free article] [PubMed] [Google Scholar]
- 13. Liu J, Li S, Zhang S, Liu Y, Ma L, Zhu J, et al. Systemic immune‐inflammation index, neutrophil‐to‐lymphocyte ratio, platelet‐to‐lymphocyte ratio can predict clinical outcomes in patients with metastatic non‐small‐cell lung cancer treated with nivolumab. J Clin Lab Anal. 2019;33(8):e22964. 10.1002/jcla.22964 [DOI] [PMC free article] [PubMed] [Google Scholar]
- 14. Jardim DL, Goodman A, de Melo Gagliato D, Kurzrock R. The challenges of tumor mutational burden as an immunotherapy biomarker. Cancer Cell. 2021;39(2):154–173. 10.1016/j.ccell.2020.10.001 [DOI] [PMC free article] [PubMed] [Google Scholar]
- 15. Addeo A, Friedlaender A, Banna GL, Weiss GJ. TMB or not TMB as a biomarker: that is the question. Crit Rev Oncol Hematol. 2021;163:103374. 10.1016/j.critrevonc.2021.103374 [DOI] [PubMed] [Google Scholar]
- 16. Addeo A, Banna GL, Weiss GJ. Tumor mutation burden—from hopes to doubts. JAMA Oncol. 2019;5(7):934–935. 10.1001/jamaoncol.2019.0626 [DOI] [PubMed] [Google Scholar]
- 17. Routy B, Le Chatelier E, Derosa L, Duong CPM, Alou MT, Daillère R, et al. Gut microbiome influences efficacy of PD‐1‐based immunotherapy against epithelial tumors. Science (New York, N.Y.). 2018;359(6371):91–97. 10.1126/science.aan3706 [DOI] [PubMed] [Google Scholar]
- 18. Hakozaki T, Richard C, Elkrief A, Hosomi Y, Benlaïfaoui M, Mimpen I, et al. The gut microbiome associates with immune checkpoint inhibition outcomes in patients with advanced non–small cell lung cancer. Cancer Immunol Res. 2020;8(10):1243–1250. 10.1158/2326-6066.CIR-20-0196 [DOI] [PubMed] [Google Scholar]
- 19. Vernocchi P, Gili T, Conte F, Del Chierico F, Conta G, Miccheli A, et al. Network analysis of gut microbiome and metabolome to discover microbiota‐linked biomarkers in patients affected by non‐small cell lung cancer. Int J Mol Sci. 2020;21(22):8730. 10.3390/ijms21228730 [DOI] [PMC free article] [PubMed] [Google Scholar]
- 20. Shi Y‐M, Niu R, Shao X‐L, Zhang F‐F, Shao X‐N, Wang J‐F, et al. Tumor‐to‐liver standard uptake ratio using fluorine‐18 fluorodeoxyglucose positron emission tomography computed tomography effectively predict occult lymph node metastasis of non‐small cell lung cancer patients. Nucl Med Commun. 2020;41(5):459–468. 10.1097/MNM.0000000000001173 [DOI] [PubMed] [Google Scholar]
- 21. Wen W, Piao Y, Xu D, Li X. Prognostic value of MTV and TLG of 18F‐FDG PET in patients with stage I and II non‐small‐cell lung cancer: a meta‐analysis. Contrast Media Mol Imaging. 2021;2021:1–8. 10.1155/2021/7528971 [DOI] [PMC free article] [PubMed] [Google Scholar]
- 22. Léger M‐A, Routy B, Juneau D. FDG PET/CT for evaluation of immunotherapy response in lung cancer patients. Semin Nucl Med. 2022;52(6):707–719. 10.1053/j.semnuclmed.2022.04.010 [DOI] [PubMed] [Google Scholar]
- 23. Banna GL, Anile G, Russo G, Vigneri P, Castaing M, Nicolosi M, et al. Predictive and prognostic value of early disease progression by PET evaluation in advanced non‐small cell lung cancer. Oncology. 2017;92(1):39–47. 10.1159/000448005 [DOI] [PubMed] [Google Scholar]
- 24. Li Y, Zhang Z, Hu Y, Yan X, Song Q, Wang G, et al. Pretreatment neutrophil‐to‐lymphocyte ratio (NLR) may predict the outcomes of advanced non‐small‐cell lung cancer (NSCLC) patients treated with immune checkpoint inhibitors (ICIs). Front Oncol. 2020;10:654. 10.3389/fonc.2020.00654 [DOI] [PMC free article] [PubMed] [Google Scholar]
- 25. Wang S, Lv J, Lv J, Li H, Liu C, Jiang H, et al. Prognostic value of lactate dehydrogenase in non‐small cell lung cancer patients with brain metastases: a retrospective cohort study. J Thorac Dis. 2022;14(11):4468–4481. 10.21037/jtd-22-1502 [DOI] [PMC free article] [PubMed] [Google Scholar]
- 26. Delikgoz Soykut E, Kemal Y, Karacin C, Karaoglanoglu O, Kurt M, Aytac Arslan S. Prognostic impact of immune inflammation biomarkers in predicting survival and radiosensitivity in patients with non‐small‐cell lung cancer treated with chemoradiotherapy. J Med Imaging Radiat Oncol. 2022;66(1):146–157. 10.1111/1754-9485.13341 [DOI] [PubMed] [Google Scholar]
- 27. Reck M, Rodríguez‐Abreu D, Robinson AG, Hui R, Csőszi T, Fülöp A, et al. Pembrolizumab versus chemotherapy for PD‐L1–positive non–small‐cell lung cancer. N Engl J Med. 2016;375(19):1823–1833. 10.1056/NEJMoa1606774 [DOI] [PubMed] [Google Scholar]
- 28. Gandhi L, Rodríguez‐Abreu D, Gadgeel S, Esteban E, Felip E, De Angelis F, et al. Pembrolizumab plus chemotherapy in metastatic non–small‐cell lung cancer. N Engl J Med. 2018;378(22):2078–2092. 10.1056/NEJMoa1801005 [DOI] [PubMed] [Google Scholar]
- 29. Paz‐Ares L, Vicente D, Tafreshi A, Robinson A, Soto Parra H, Mazières J, et al. A randomized, placebo‐controlled trial of pembrolizumab plus chemotherapy in patients with metastatic squamous NSCLC: protocol‐specified final analysis of KEYNOTE‐407. J Thorac Oncol. 2020;15(10):1657–1669. 10.1016/j.jtho.2020.06.015 [DOI] [PubMed] [Google Scholar]
- 30. Mezquita L, Auclin E, Ferrara R, Charrier M, Remon J, Planchard D, et al. Association of the Lung Immune Prognostic Index with immune checkpoint inhibitor outcomes in patients with advanced non‐small cell lung cancer. JAMA Oncol. 2018;4(3):351–357. 10.1001/jamaoncol.2017.4771 [DOI] [PMC free article] [PubMed] [Google Scholar]
- 31. Banna GL, Cantale O, Muthuramalingam S, Cave J, Comins C, Cortellini A, et al. Efficacy outcomes and prognostic factors from real‐world patients with advanced non‐small‐cell lung cancer treated with first‐line chemoimmunotherapy: the spinnaker retrospective study. Int Immunopharmacol. 2022;110:108985. 10.1016/j.intimp.2022.108985 [DOI] [PubMed] [Google Scholar]
- 32. Banna GL, Cortellini A, Cortinovis DL, Tiseo M, Aerts JGJV, Barbieri F, et al. The lung immuno‐oncology prognostic score (LIPS‐3): a prognostic classification of patients receiving first‐line pembrolizumab for PD‐L1 ≥ 50% advanced non‐small‐cell lung cancer. ESMO Open. 2021;6(2):100078. 10.1016/j.esmoop.2021.100078 [DOI] [PMC free article] [PubMed] [Google Scholar]
- 33. Bigot F, Castanon E, Baldini C, Hollebecque A, Carmona A, Postel‐Vinay S, et al. Prospective validation of a prognostic score for patients in immunotherapy phase I trials: the Gustave Roussy immune score (GRIm‐score). Eur J Cancer (Oxford, England: 1990). 2017;84:212–218. 10.1016/j.ejca.2017.07.027 [DOI] [PubMed] [Google Scholar]
- 34. Arkenau H‐T, Olmos D, Ang JE, de Bono J, Judson I, Kaye S. Clinical outcome and prognostic factors for patients treated within the context of a phase I study: the Royal Marsden Hospital experience. Br J Cancer. 2008;98(6):1029–1033. 10.1038/sj.bjc.6604218 [DOI] [PMC free article] [PubMed] [Google Scholar]
- 35. Mantovani A, Allavena P, Sica A, Balkwill F. Cancer‐related inflammation. Nature. 2008;454(7203):436–444. 10.1038/nature07205 [DOI] [PubMed] [Google Scholar]
- 36. Altorki NK, Markowitz GJ, Gao D, Port JL, Saxena A, Stiles B, et al. The lung microenvironment: an important regulator of tumour growth and metastasis. Nat Rev Cancer. 2019;19(1):9–31. 10.1038/s41568-018-0081-9 [DOI] [PMC free article] [PubMed] [Google Scholar]
- 37. Macciò A, Madeddu C. Blocking inflammation to improve immunotherapy of advanced cancer. Immunology. 2020;159(4):357–364. 10.1111/imm.13164 [DOI] [PMC free article] [PubMed] [Google Scholar]
- 38. Berraondo P, Sanmamed MF, Ochoa MC, Etxeberria I, Aznar MA, Pérez‐Gracia JL, et al. Cytokines in clinical cancer immunotherapy. Br J Cancer. 2019;120(1):6–15. 10.1038/s41416-018-0328-y [DOI] [PMC free article] [PubMed] [Google Scholar]
Associated Data
This section collects any data citations, data availability statements, or supplementary materials included in this article.
Supplementary Materials
Table S1. ROC‐derived cutoffs for the SUVratios and peripheral blood inflammation indexes.a.
Table S2. Univariable Cox regression model on OS and PFS according to ROC‐based cutoffs only immunotherapy (n = 25).