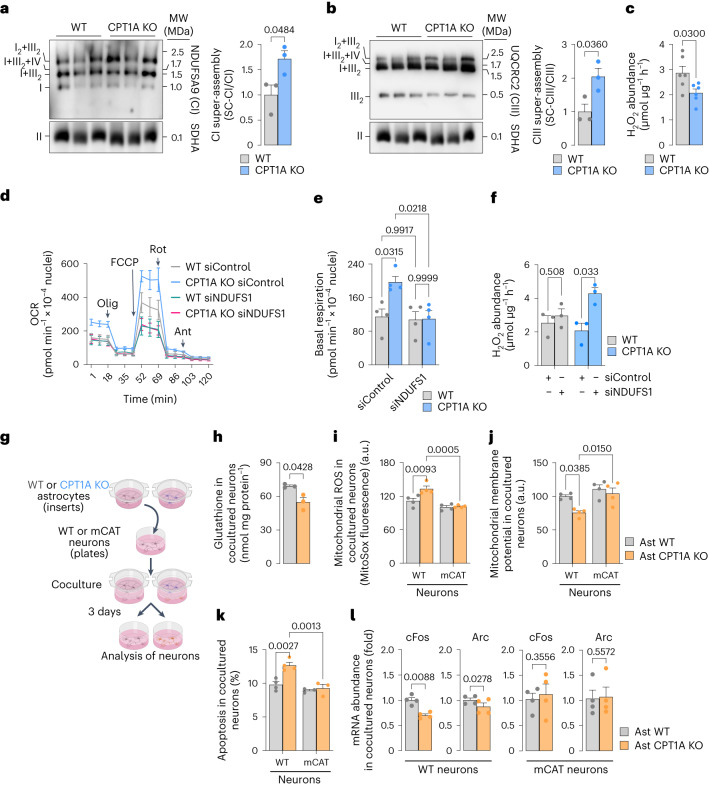
Fig. 3. KO of Cpt1a in astrocytes induces mitochondrial SCs leading to increased respiration and decreased ROS affecting bioenergetics and function of cocultured neurons.
a, Free CI and CI-containing SCs (SC-CI) in WT and Cpt1a KO primary astrocytes, analysed by BNGE followed by immunoblotting against CI subunit NDUFA9. Data are mean ± s.e.m. P values are indicated (n = 3 biologically independent cell culture preparations; unpaired Student’s t-test, two-sided). b, Free CIII and CIII-containing SCs (SC-CIII) in WT and Cpt1a KO primary astrocytes, analysed by BNGE followed by immunoblotting against CIII subunit UQCRC2. Data are mean ± s.e.m. P values are indicated (n = 3 biologically independent cell culture preparations; unpaired Student’s t-test, two-sided). c, H2O2 production in WT and CPT1A KO astrocytes in primary culture. Data are mean ± s.e.m. P values are indicated (n = 6 independent cell culture preparations; unpaired Student’s t-test, two-sided). d, OCR analysis in WT and Cpt1a KO astrocytes in primary culture, either transfected with scrambled (control) or NDUFS1 siRNAs. Data are mean ± s.e.m. P values are indicated (n = 4 biologically independent cell culture preparations) (Supplementary Fig. 3f). e, Basal respiration in WT and CPT1A KO astrocytes in primary culture, either transfected with scrambled (control) or NDUFS1 siRNAs. Data are mean ± s.e.m. P values are indicated (n = 4 biologically independent cell culture preparations; two-way ANOVA followed by Tukey). f, H2O2 production by WT and CPTA1A KO astrocytes in primary culture, either transfected with scrambled (control) or NDUFS1 siRNAs. Data are mean ± s.e.m. P values are indicated (n = 3 biologically independent cell culture preparations; multiple unpaired Student’s t-test). g, Strategy used to assess the effect of Cpt1a KO astrocytes on WT or mCAT neurons in primary culture. Created with BioRender.com. h–l, Glutathione concentration (h), mitochondrial ROS (i), ∆ψm (j), apoptosis (k) and c-Fos and Arc mRNA abundances (l) in WT or mCAT-expressing transgenic neurons after coculture with WT or Cpt1a KO astrocytes; n = 3 (h), 4 (i), 4 (j), 4 (k, WT), 4 (k, mitoCAT) and 4 (l) biologically independent cell culture preparations; paired Student’s t-test, two-sided for simple comparisons and two-way ANOVA followed by Tukey for multiple comparisons.

