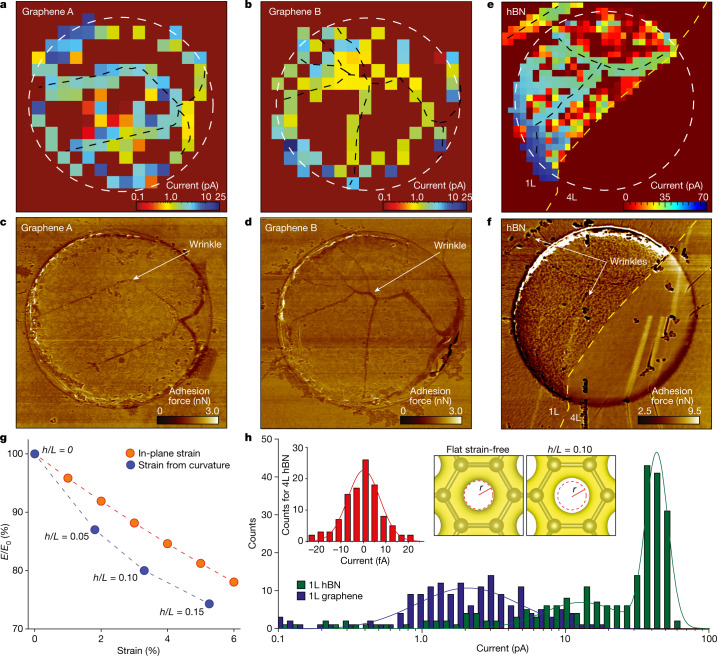
Fig. 2. Unexpected inhomogeneity of proton transport through 2D crystals.
a,b, SECCM maps for two graphene devices. The white dashed circles mark the rim of the 2-μm-diameter apertures in SiNx. c,d, AFM force maps for the devices in the panels above. Wrinkles and edges are clearly visible in the AFM maps and correlate with high-conductivity areas in the SECCM maps. For easier comparison, the black dashed curves in a and b mark wrinkles’ positions. e, Proton currents through an hBN device. Yellow dashed curve, border between monolayer (1L; left) and tetralayer (4L; right) hBN. f, AFM force map for the device in e. Apparent wrinkles are indicated by the arrows and marked by the black dashed curves in e. A particular feature of this device is notable proton currents in the top left corner in e, away from the aperture in SiNx. Extended Data Fig. 6 reveals that this feature is due to a wrinkle originating from a neighbouring aperture. The wrinkle provides a nanocavity between hBN and the SiNx substrate, which allows protons to reach this area. g, Strain lowers the energy barrier E for proton permeation (E0 is the barrier for unstrained graphene). Blue symbols, the effect of strain arising from curvature; values of h/L are specified next to each point. Red data, E/E0 due to purely in-plane strain. h, Statistics of proton currents for graphene and hBN monolayers (data from a,b,e). Left inset, statistics collected from the tetralayer region. Solid curves, best Gaussian and double-Gaussian fits for graphene and monolayer hBN, respectively (accuracy of about 10% in determining the modes of the normal distributions). The right two-panel inset shows the calculated electron density provided by the crystal lattice for unstrained (left) and strained (right) graphene; the latter calculations are for strain arising from curvature with h/L = 0.10. To make changes in the electron density evident, the dashed red circle in the left panel marks the boundary between regions8 with densities above and below 0.2 e Å−3 (the latter region is shown in white). The same circle is projected onto the right panel and emphasizes that the low-density region expanded in the strained lattice.

