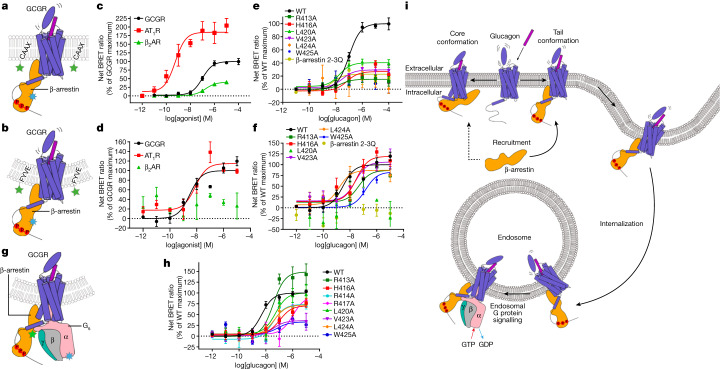
Fig. 4. The tail conformation of GCGR–βarr mediates cellular trafficking and megaplex formation.
a,c,e, Agonist-induced plasma membrane βarr recruitment measured by the BRET assay. Schematic of the tail conformation of the GCGR–βarr complex in the plasma membrane (a). The biosensors labelled in βarr and CAAX that were used in the BRET assay are indicated by blue and green stars, respectively. The plasma membrane βarr recruitment of the wild-type (WT) GCGR, AT1R and β2AR (c). The plasma membrane βarr recruitment of the WT GCGR and mutants (e). b,d,f, Agonist-induced endocytosis measured by the BRET assay. Schematic of the tail conformation of the GCGR–βarr complex within the endosome (b). The biosensors labelled in βarr and FYVE that were used in the BRET assay are indicated by blue and green stars, respectively. Endocytosis of the WT GCGR, AT1R, and β2AR (d). Endocytosis of the WT GCGR and mutants (f). The horizontal dotted lines in a–f indicate the base lines with the net BRET ratio as zero. g,h, Glucagon-induced Gs–βarr interaction measured by the BRET assay. Schematic of the Gs–GCGR–βarr megaplex (g). The biosensors labelled in Gαs and βarr that were used in the BRET assay are indicated by blue and green stars, respectively. The Gs–βarr interaction promoted by the WT GCGR and mutants (h). The data of the plasma membrane recruitment, endocytosis and the Gs–βarr interaction are shown as mean ± s.e.m. from at least three independent experiments performed in technical duplicate. Extended Data Tables 3 and 4 provide detailed numbers of independent experiments (n), statistical evaluation, P values and expression levels. i, Schematic representation of the functional processes mediated by the GCGR–βarr complex. The tail conformation has major roles in the plasma membrane βarr recruitment, internalization and megaplex formation. The core conformation may contribute to the plasma membrane recruitment to a lesser extent than the tail conformation.

