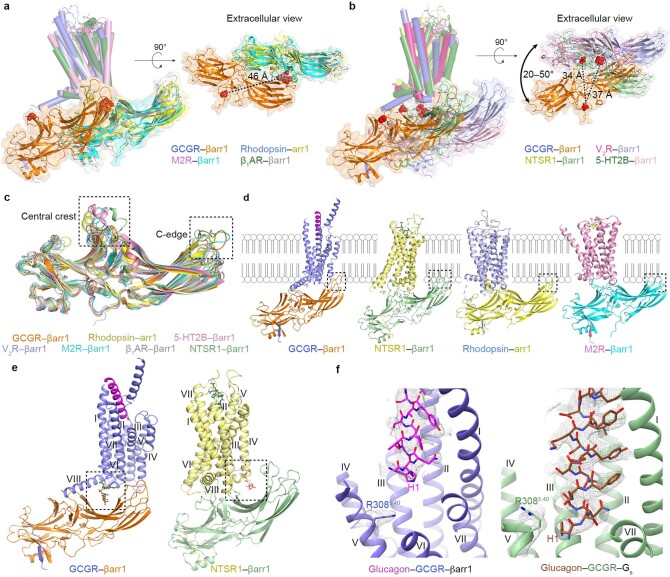
Extended Data Fig. 3. Comparison of the glucagon–GCGR(V2RC)–βarr1 structure with the other known GPCR–arrestin structures and the glucagon–GCGR–Gs structure.
a, Structural comparison of the glucagon–GCGR(V2RC)–βarr1 complex with the rhodopsin–arr1, M2R–βarr1 and β1AR–βarr1 complexes (PDB IDs: 4ZWJ, 6U1N, and 6TKO). The structures are shown in membrane view (left) and extracellular view (right). Only the arrestins are shown in the extracellular view. The residue D135 in the middle loop of βarr1 (D139 in arr1) in each structure is also shown as red spheres. The distance between the residue D135 in the glucagon–GCGR(V2RC)–βarr1 structure and the counterparts in the other GPCR–arrestin structures is indicated by a black dashed line. b, Structural comparison of the glucagon–GCGR(V2RC)–βarr1 complex with the V2R–βarr1, NTSR1–βarr1 and 5-ΗΤ2Β–βarr1 complexes (PDB IDs: 7R0C, 6UP7, and 7SRS). c, Conformational comparison of the arrestins in the known GPCR–arrestin structures. The central crest and C-edge are highlighted by two black dashed boxes. d, Comparison of the arrestin C-edge–membrane interaction in the structures of glucagon–GCGR(V2RC)–βarr1, NTSR1–βarr1, rhodopsin–arr1 and M2R–βarr1. The C-edge in each structure is highlighted by a black dashed box. e, Comparison of the phospholipid binding sites in the glucagon–GCGR(V2RC)–βarr1 and NTSR1–βarr1 structures. The phospholipid diC8-PtdIns(4,5)P2 is shown as sticks and its binding site is highlighted by a black dashed box in each structure. f, Comparison of the glucagon binding modes and the conformations of the GCGR residue R3085.40 in the glucagon–GCGR(V2RC)–βarr1 and glucagon–GCGR–Gs structures. Glucagon and the residue R3085.40 in the two structures are shown as sticks, and their densities are coloured grey.

