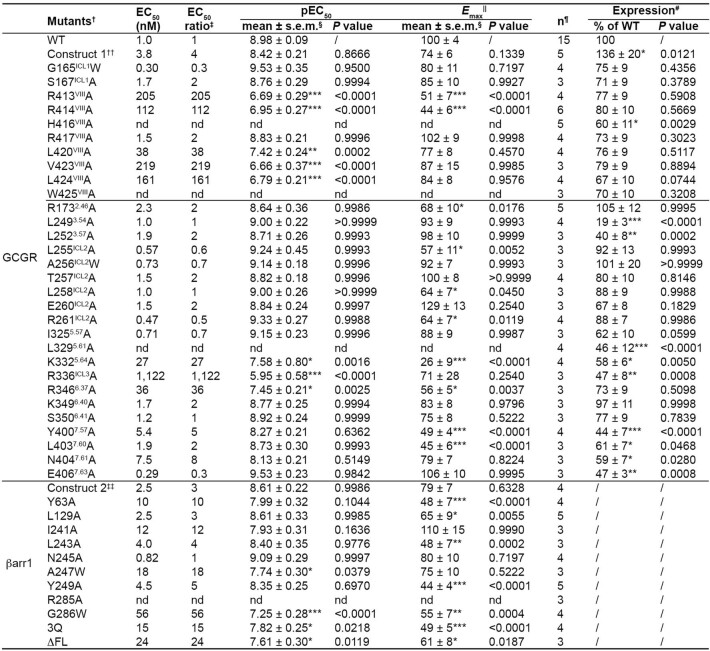
Extended Data Table 1.
Interaction between GCGR and βarr1, measured by BRET assay
†All mutations were introduced in the wild-type GCGR or βarr1 (WT). ΔFL, the βarr1 mutant with the turn region of the finger loop (residues 66–73) removed.
‡The EC50 ratio (EC50(mutant)/EC50(WT)) represents the shift between the WT and mutant curves, and characterizes the effect of the mutations on the GCGR-βarr1 interaction.
§Data are mean ± s.e.m. from at least three independent experiments. *P < 0.05, **P < 0.001, ***P < 0.0001 by one-way analysis of variance followed by Dunnett’s post-test compared to the response of WT. nd, not determined (data for which the concentration response curve could not reach effect saturation within the concentration range tested).
||The maximal response is reported as a percentage of the maximum effect at the WT.
¶Sample size, the number of independent experiments performed in technical duplicate.
#Protein expression levels of GCGR constructs at the cell surface were determined in parallel by flow cytometry with an anti-Flag antibody (Sigma) and reported as per cent compared to the WT from at least three independent measurements performed in technical duplicate.
††Construct 1, the GCGR construct that was used to determine the structures.
‡‡Construct 2, the βarr1 construct that was used to determine the structures.

