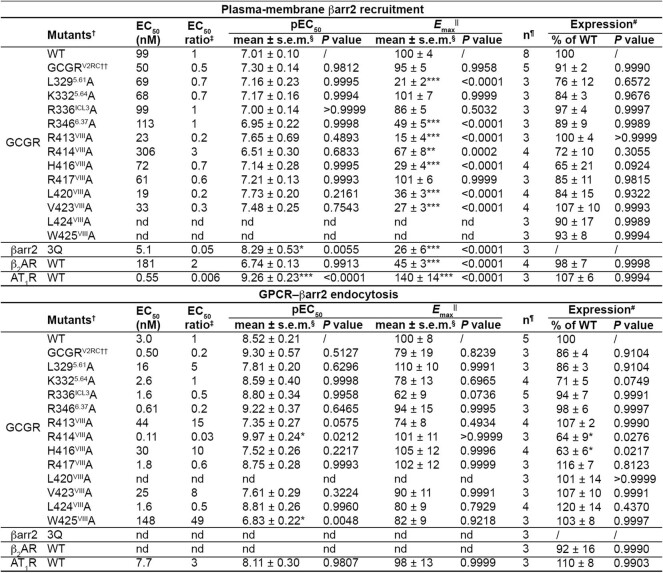
Extended Data Table 3.
Agonist-induced plasma-membrane βarr2 recruitment and GPCR–βarr2 endocytosis, measured by BRET assay
†All mutations were introduced in the wild-type GCGR or βarr2 (WT).
‡The EC50 ratio (EC50(mutant)/EC50(WT)) represents the shift between the WT and mutant curves, and characterizes the effect of the mutations on the plasma-membrane recruitment or endocytosis.
§Data are mean ± s.e.m. from at least three independent experiments. *P < 0.05, **P < 0.001, ***P < 0.0001 by one-way analysis of variance followed by Dunnett’s post-test compared to the response of WT. nd, not determined (data for which the concentration response curve could not reach effect saturation within the concentration range tested).
||The maximal response is reported as a percentage of the maximum effect at the WT.
¶Sample size, the number of independent experiments performed in technical duplicate.
#Protein expression levels of GCGR, β2AR and AT1R constructs at the cell surface were determined in parallel by flow cytometry with an anti-Flag antibody (Sigma) and reported as per cent compared to the wild-type GCGR from at least three independent measurements performed in technical duplicate.
††The GCGR construct with the C-terminal region (residues H433–F477) replaced with the C-terminal tail of V2R (residues A343–S371).

