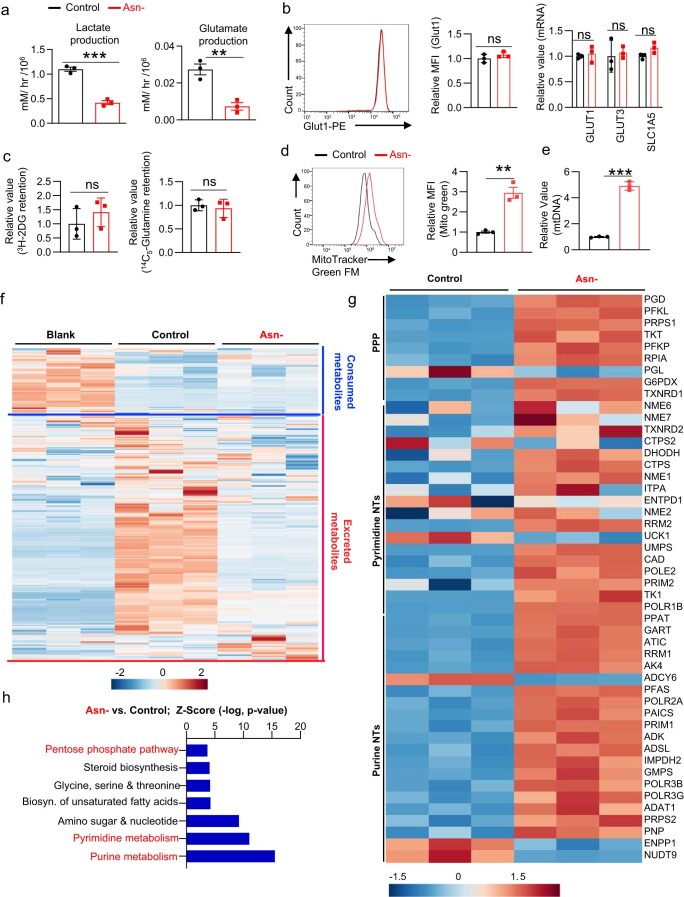
Extended Data Fig. 3. Asn restriction rewires the central carbon metabolism in CD8+ T cells.
a) The indicated metabolites were quantified by the YSI bioanalyzer. The production was determined by calculating the difference between blank and spent medium (6 hr incubation of T cells collected in the late phase/72 hr) (n = 3 experimental replicates, P = 0.0003 and P = 0.0048 for lactate and glutamate production respectively). b) Cell surface expression of Glut1 was determined by flow, and mRNA expression of indicated genes was quantified by qPCR. (n = 3 experimental replicates, P = 0.27 for Glut1 expression and P = 0.61, P = 0.73 and P = 0.06 for Glut1, Glut 3 and Slc1a5 respectively). c) glucose and glutamine uptake were determined by intracellular retention of [3H]-2-deoxy-glucose and [14C5]-glutamine, respectively (n = 3 experimental replicates, P = 0.39 and P = 0.64 for glucose and glutamine uptake respectively). d-e) Mitochondria mass was determined by Mito Tracker green FM staining by flow cytometry (d) (n = 3, P = 0.0021), and mitochondrial DNA was quantified by qPCR (e) (n = 3, (P < 0.0001). Data are representative of 3 independent experiments. f) The extracellular metabolome of indicated groups was determined by LC-MS (Fig. 3a). (g-h) Differently expressed metabolic gene signatures were determined by the IPA analysis of RNAseq (in the late phase/72 h) (g) and a heatmap depicting log 10-fold change of differentially expressed metabolic genes (P = 0.0081) (h). Data from f-h are representative of one experiment. Error bars represent mean ± SD. *P < 0.05, **P < 0.01, *** P < 0.001. Statistical differences were determined by unpaired Two-tail Student’s t-test (a-d) paired Two-tail Student’s t-test (h).

