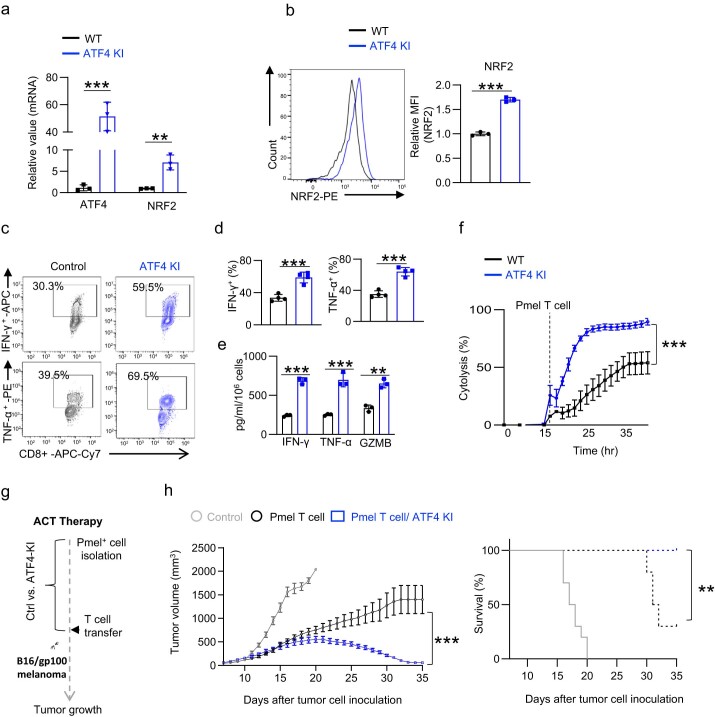
Extended Data Fig. 7. Activation of ATF4 enhances CD8+ T cell effector functions.
a) The level of the indicated mRNA was determined by qPCR (n = 3 experimental replicates, P = 0.0012 and P = 0.0038 for ATF4 and NRF2 respectively). b) Representative flow plots (left) and quantification of NRF2 expression in indicated genotype (n = 3 experimental replicates, P < 0.001). (c-h) Cells with indicated genotypes were activated for 5 days, followed by restimulation with soluble antibodies (2 days). The expression of indicated cytokines was determined by flow cytometry (c-d) (n = 4 experimental replicates, P = 0.0007 and P = 0.0002 for IFN-γ and TNF-α respectively). The indicated protein in the cell culture medium collected 5 days after activation was quantified by ELISA (e) (n = 3 experimental replicates, P < 0.0001, P = 0.001 and P = 0.0014 for IFN-γ, TNF-α and GZMB respectively). Data from a-e are representative of 3 independent experiments. The cytolysis was determined by eSight (f) (n = 3 experimental replicates, P < 0.0001). Data are representative of 2 independent experiments. Error bars represent mean ± SD. Schematic diagram of the experiment (g). Tumor growth (left, h) and Kaplan-Meier survival curves (right, h) of mice bearing B16-gp100 tumor (n = 10 mice per group, left panel: P < 0.0001; right panel: P = 0.0013). Data are representative of 2 independent experiments. Error bars represent mean ± SEM. *P < 0.05, **P < 0.01, *** P < 0.001, ns, not significant. Statistical differences were determined by unpaired Two-tail Student’s t-test (a, b and d-e) and Two-way ANOVA (f and h) for tumor growth curve, and log-rank test for animal survival.

