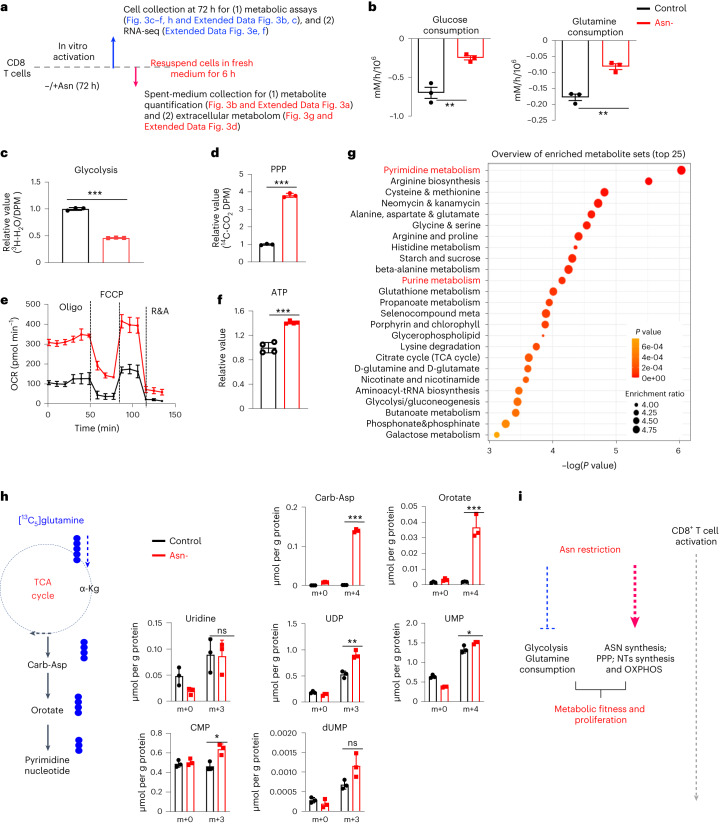
Fig. 3. Asn restriction reduces carbon consumption but promotes nucleotide biosynthesis.
a, Schematic diagram of sample collection and assays. b, The indicated metabolites were quantified by the YSI bioanalyzer. Consumption was determined by calculating the difference between blank and spent medium (6-h incubation of T cells collected in the late phase (72 h)) (n = 3 experimental replicates; P = 0.0043 and P = 0.002 for glucose and glutamine consumption, respectively). c,d, T cells were collected in the late phase (72 h). Glycolysis activity (c) (n = 3 experimental replicates; P < 0.0001) and PPP activity (d) (n = 3 experimental replicates; P < 0.0001) were determined by measuring 3H2O generated from D-[5-3H(N)]glucose and 14CO2 generated from [1-14C]D-glucose, respectively. e, OCR (in the late phase (72 h)) was determined by Seahorse (n = 3 experimental replicates; P < 0.0001), R&A, Rotenone and Antimycin A. f, ATP levels (in the late phase (72 h)) were determined by the CellTiter-Glo 2.0 Assay kit (n = 3 experimental replicates; P < 0.0001). Data in b–f are representative of three independent experiments. g, Kyoto Encyclopedia of Genes and Genomes (KEGG) enrichment analysis of the changes of extracellular metabolites (6 h spent medium). The figure is plotted with the first 25 pathways. h, Diagram of [13C5]glutamine catabolism through entering the downstream TCA cycle and pyrimidine biosynthesis. Filled circles denote the 13C label of all carbons of indicated metabolites derived from [13C5]glutamine catabolism (left panel). Metabolites in cells (in the late phase (72 h)) were analyzed by IC–UHR-FTMS (right panel); numbers on the x axis represent those of 13C atoms in given metabolites, and numbers on the y axis represent the levels of the metabolites (μmol per g protein). Carb-Asp, N-carbamoyl-L-aspartate; UDP, uridine diphosphate; UMP, uridine monophosphate; CMP, cytidine monophosphate; dUMP, deoxyuridine monophosphate. n = 3 experimental replicates; P < 0.0001, P = 0.0014, P = 0.9185, P = 0.003, P = 0.0418, P = 0.0118 and P = 0.0617 for Carb-Asp, orotate, uridine, UDP, UMP, CMP and dUMP, respectively. Data are representative of two independent experiments. Error bars represent mean ± s.d. *P < 0.05; **P < 0.01; ***P < 0.001. Statistical differences were determined by unpaired two-tailed Student’s t-test (b–d, f and h) and paired two-tailed Student’s t-test (e). MetaboAnalyst (v5.0) generated enrichment plots with a significance threshold of P < 0.05 (g). i, The conceptual model of Asn restriction improved Teff cell metabolic fitness and proliferation by reducing carbon consumption but increasing the production of the intracellular nucleotide pool. ASN, asparagine; NTs, nucleotides; OXPHOS, oxidative phosphorylation.

