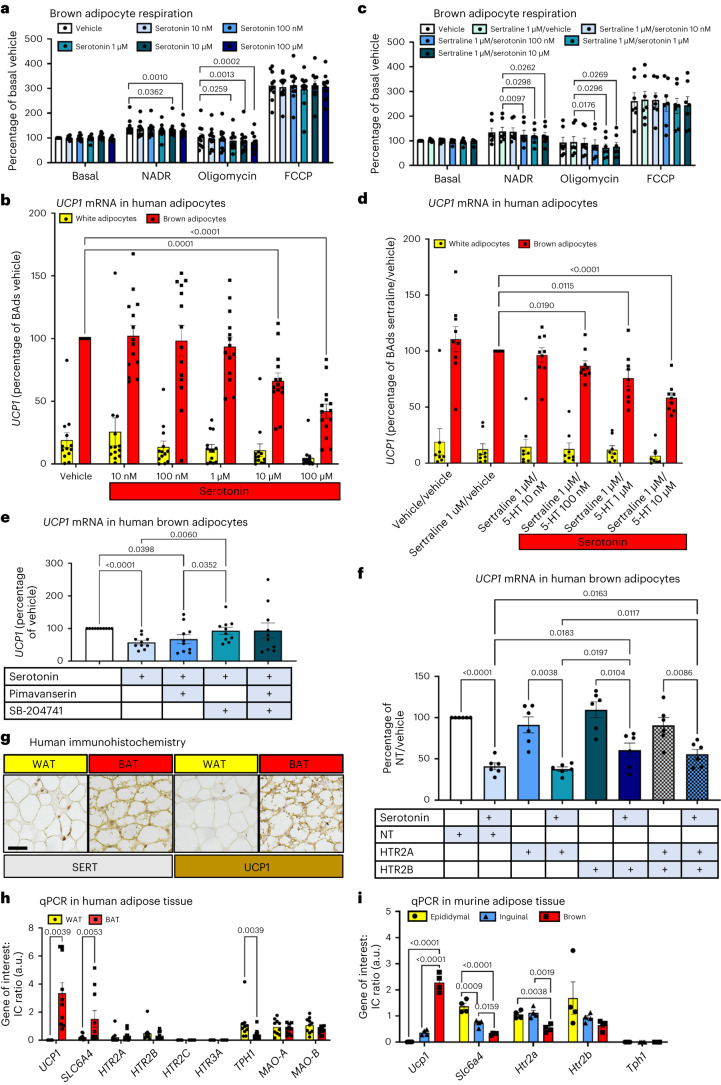
Fig. 2. Serotonin inhibits UCP1 through the 5-HT2B receptor in human brown adipocytes.
a, OCR in human brown adipocytes (n = 11 biologically independent samples) cultured in vehicle or serotonin (10 nM to 100 μM) for 24 h, presented as the percentage of basal OCR during vehicle. NADR, noradrenaline. b, UCP1 mRNA levels in paired human white (yellow columns; n = 13 biologically independent samples) and brown (red; n = 14 biologically independent samples) adipocytes incubated with vehicle or ascending serotonin concentrations. BAds, brown adipocytes. c, OCR in human brown adipocytes (n = 7 biologically independent samples) cultured in vehicle, sertraline (1 μM) or sertraline plus serotonin (10 nM to 10 μM) for 24 h, presented as the percentage of basal OCR during vehicle. d, UCP1 mRNA levels in paired human white (n = 8 biologically independent samples) and brown (n = 9 biologically independent samples) adipocytes incubated with vehicle, sertraline (1 μM) or sertraline plus serotonin (10 nM to 10 μM) for 24 h. e, UCP1 mRNA levels in primary human brown adipocytes incubated with 100 μM serotonin with or without the inverse 5-HT2A agonist pimavanserin (10 μM) or the 5-HT2B receptor antagonist SB-204741 (10 μM) (n = 10 biologically independent samples). f, UCP1 mRNA levels in primary human brown adipocytes (n = 6 biologically independent samples) incubated with either vehicle or 100 μM serotonin for 24 h following siRNA-knockdown of HTR2A, HTR2B, both or an NT control. Significant P values are shown for comparisons between the respective vehicles of each group and between the groups of serotonin-treated cells. g, Immunohistochemistry of human WAT (yellow) and BAT (red), expression of SERT (left) and UCP1 (right) in BAT indicated by brown staining. Scale bar, 40 μm. h, mRNA expression in human BAT versus WAT (n = 10 biologically independent samples). i, mRNA expression in murine BAT (red) versus inguinal (beige; blue) or epididymal WAT (yellow) (n = 4 biologically independent samples). Data are mean ± s.e.m. Data were analysed by one-way (a,c,e,f) or two-way (b,d) repeated measures ANOVA, Wilcoxon signed-rank test (h) or one-way ANOVA (i). Significant P values are detailed in the respective panels.

