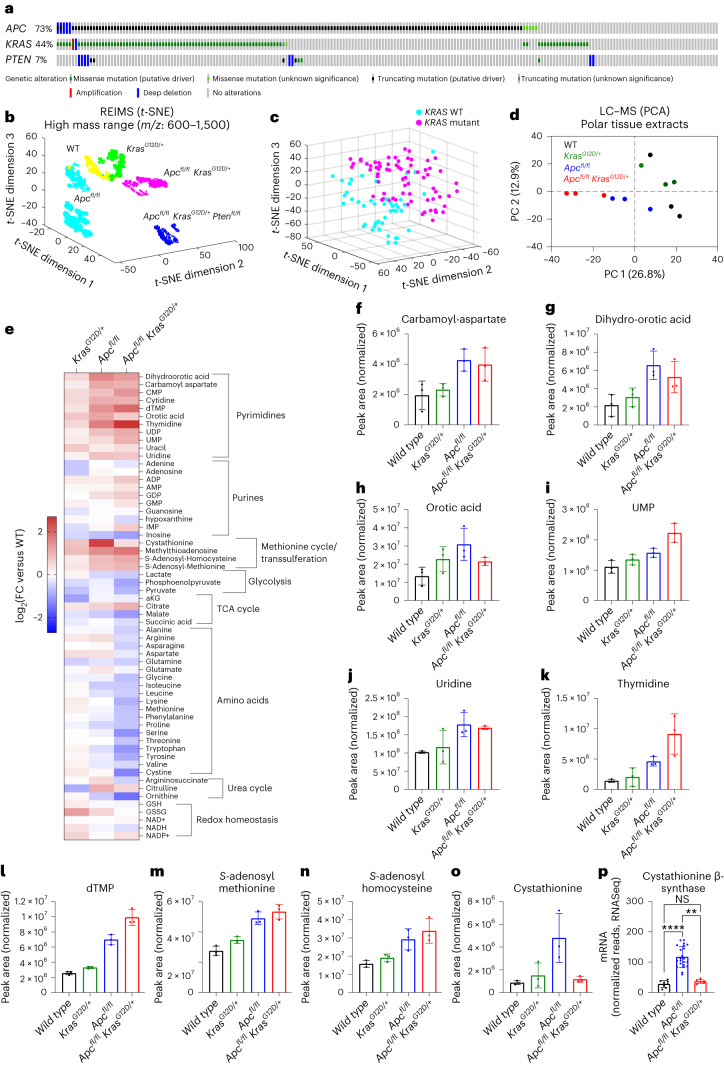
Fig. 1. Stratification of genetically engineered mouse models of intestinal hyperproliferation by metabolic profiling.
a, Oncoprint showing genetic alterations of APC, KRAS and PTEN in human colorectal adenocarcinoma (TCGA, Firehose Legacy; https://www.cbioportal.org/). b, t-SNE plot of REIMS data acquired from small intestinal epithelium after specific activation of oncogenic drivers focusing analysis on ions within a mass range of m/z 600–1,500. Each symbol corresponds to a single mass spectrum acquired using the REIMS forceps. Data were acquired from WT (n = 3), KRAS (n = 4), APC (n = 11), APC KRAS (n = 4) and APC KRAS PTEN (n = 5) mice. c, Three-dimensional t-SNE visualization of REIMS data collected from ex vivo clinical samples using only 50 significant classification features within a mass range of m/z 50–1,200. Each dot corresponds to a single mass spectrum described by the 50 features. Multiple spectra were collected from the same patient as technical replicates in the training data. Data were acquired from KRAS-WT (n = 8) and KRAS-mutant (n = 16) samples. d, PCA of untargeted LC–MS data (1,270 features) acquired from polar extracts of small intestinal tissues from WT, KRAS, APC, and APC KRAS mice (n = 3 for each genotype). e, Heat map showing differences in metabolite abundance in small intestinal tissues of KRAS, APC and APC KRAS mice compared with WT mice (targeted analysis of LC–MS data; heat map constructed based on fold change between the averages of each experimental group; n = 3). f–o, Plots showing normalized abundances of intermediates of de novo pyrimidine synthesis (f–h), pyrimidine nucleo(s)(t)ides (i–l) and intermediates of the methionine cycle/transsulferation pathway (m–o). In f–o, data are the mean ± s.d., and each dot represents data from an individual mouse (n = 3 mice for each genotype). p, Cystathionine β-synthase gene expression as analysed by RNA-seq in the small intestine of WT (n = 8), APC (n = 22) and APC KRAS (n = 6) mice. Data are the mean ± s.d., and each dot represents data from an individual mouse. Asterisks refer to P values obtained from Kruskal–Wallis test followed by Dunn’s correction (**P = 0.0026; ****P < 0.0001; not significant (NS), P > 0.9999). TCA, tricarboxylic acid.

