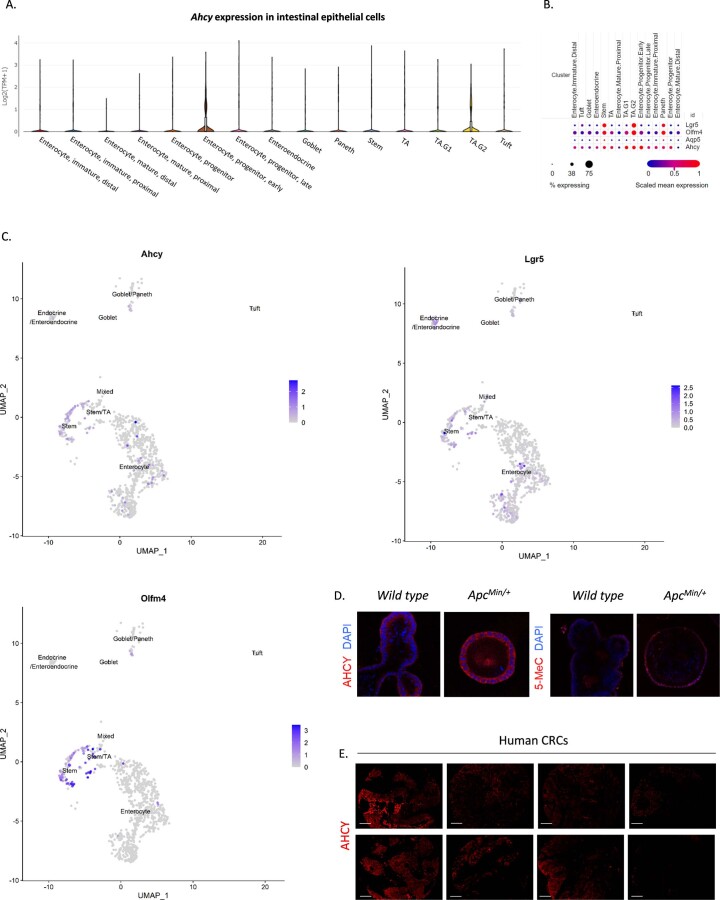
Extended Data Fig. 6. Expression of Ahcy and established stem cell markers in the wild type and APC-deficient murine intestine, and AHCY protein expression.
(A) Violin plot showing Ahcy gene expression across the different cell populations of the wild type mouse small intestine20 (Image available from: https://singlecell.broadinstitute.org/single_cell/study/SCP44/small-intestinal-epithelium?genes=Ahcy&tab=distribution#study-visualize). (B) Dot plot showing Lgr5, Olfm4, Ahcy, and Aqp5 expression across the different cell populations of the wild type mouse small intestine20 (Image available from: https://singlecell.broadinstitute.org/single_cell/study/SCP44/small-intestinal-epithelium?genes=lgr5%2Colfm4%2Caqp5%2CAhcy&tab=distribution#study-visualize). (C) UMAP plots showing expression of Ahcy, Lgr5, and Olfm4 across the different cell populations of the Apc-deficient mouse small intestine. (data from n = 2 APC mice) (D) IF showing AHCY protein expression and abundance of 5-methylcytosine in organoids derived from the intestine of WT mice, and from adenomas in ApcMin/+ mice. Image from a single experiment with 4 technical replicates. (E) IF showing AHCY expression in human CRC. Scale bars: 100 µm. (Images derived from 8 CRC samples, from a cohort of 49 CRC samples analysed).

